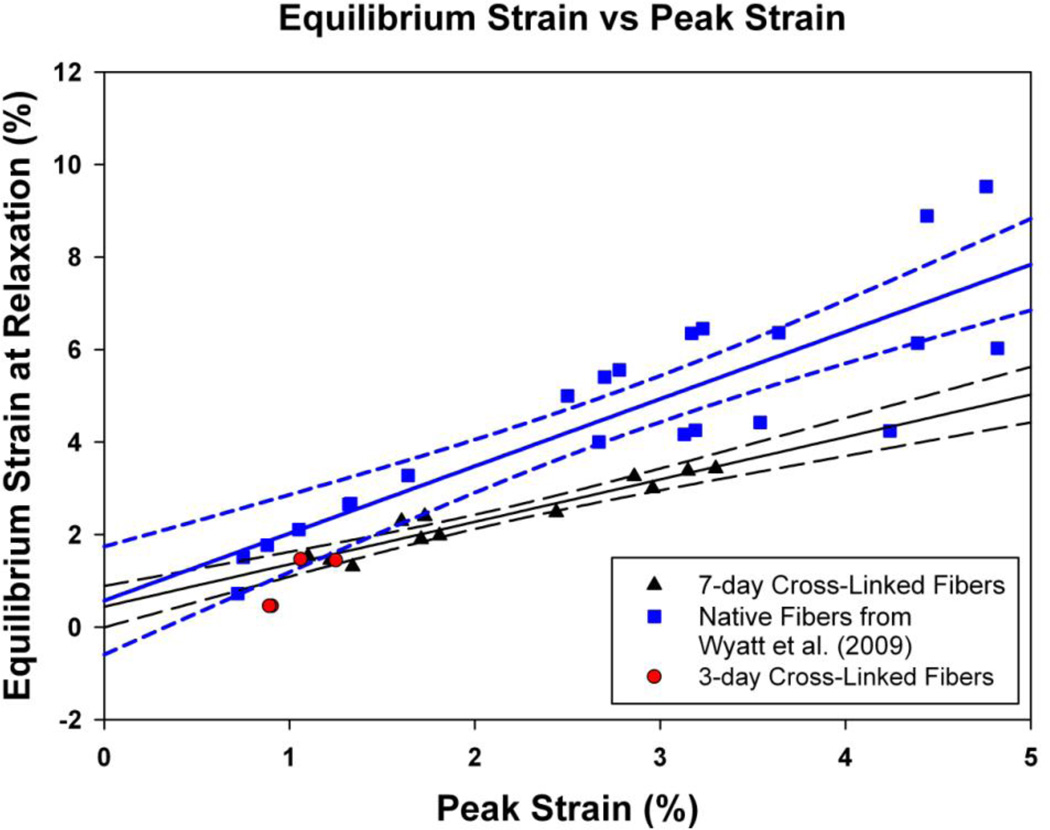
Figure 3. Equilibrium Strain vs. Peak Strain.
The peak and equilibrium strains from the mechanical relaxation tests for the 7-day glycation cross-linked fibers (black triangles) were compared to historical data for native fibers (blue squares) from our previous study (Wyatt et al., 2009). 3-day cross-linked fiber data is also shown (red circles) but excluded from regression analysis. The peak and equilibrium strains were plotted and the relationship between them was fit with a regression line model (mean regression line ± 95% confidence intervals as solid and dotted lines respectively) using SigmaPlot 10 software (Systat Software, Inc., Chicago, IL). The 7-day cross-linked fiber was not statistically different from 1 (n = 12), whereas the native fibers’ equilibrium strain was 45% greater after relaxation (n = 23).

