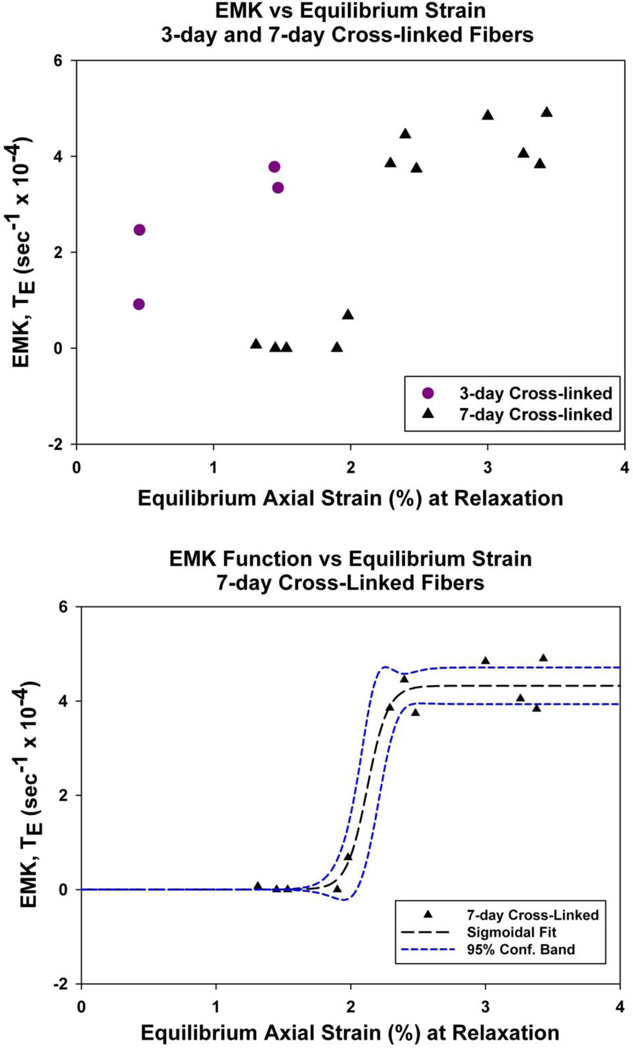
Figure 4. EMK Function vs. Equilibrium Strain.
(Top) Both the ‘3-day cross-linked’ and ‘7-day cross-linked’ fibers showed increasing collagenase degradation with increasing strain (indicated by the increasing EMK Function, TE (ε), values).
(Bottom) The 7-day fiber data was well described with a 3-parameter sigmoidal function (r = 0.987), which indicates an “Off-to-On” transition around 2% as the axial strain increased from 0% to 3.4% (2.12 ± 0.05 % strain, coefficient ± standard error).

