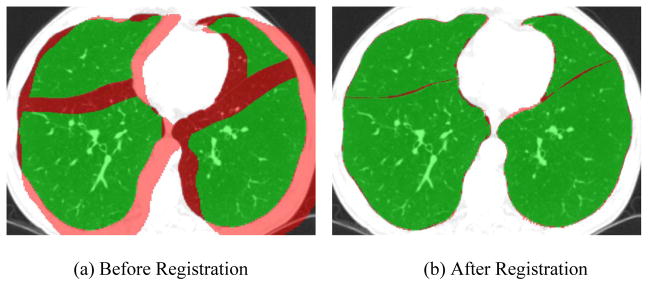
Figure 5.

An example of the registration result after the application of Method-AB to a pair of inspiration and expiration CT examinations acquired on the same subjects. The overlays in green represented the area where the lobes identified in different examinations were overlapped and the overlay in red represented the area where there was no overlapping between these lobes.
