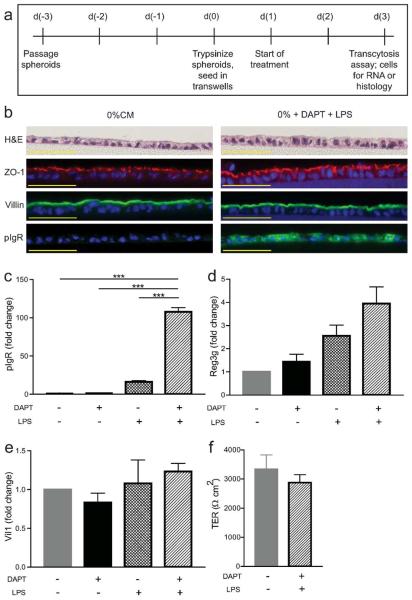
Figure 1. Developing a transwell system using mouse primary intestinal epithelial cells.
(a) Schematic of timeline for Transwell experiments. Wild type cells were treated with +/− 10 μM DAPT +/− 1 μg/ml LPS and were analyzed on day three post-seeding. (b) Cells were fixed and paraffin-embedded on the transwell membranes. Sections were cut and stained with the following: hematoxylin and eosin, anti-ZO-1, anti-villin, and anti-pIgR. Bars = 50 μm. Gene expression analysis was performed by qRT-PCR for pIgR (c), Reg3g (d), and Vil1 (e). All samples were normalized to Gapdh mRNA, and data were presented as fold change relative to untreated (0% CM) cells (mean ± s.e.m.; n ≥ 3 per condition). One-way ANOVA: (c) F = 96.02, P < 0.0001; (d) F = 3.441, P < 0.0376; (e) F = 1.085, P < 0.3762. ***P < 0.001 by Bonferroni's multiple comparison test. (f) Transepithelial electrical resistance was measured on day three. The (resistance × area) is shown for each condition (mean ± s.e.m., n = 6 per group). Statistical analysis by Student's t-test showed no significant difference between the two groups (P < 0.4362).

