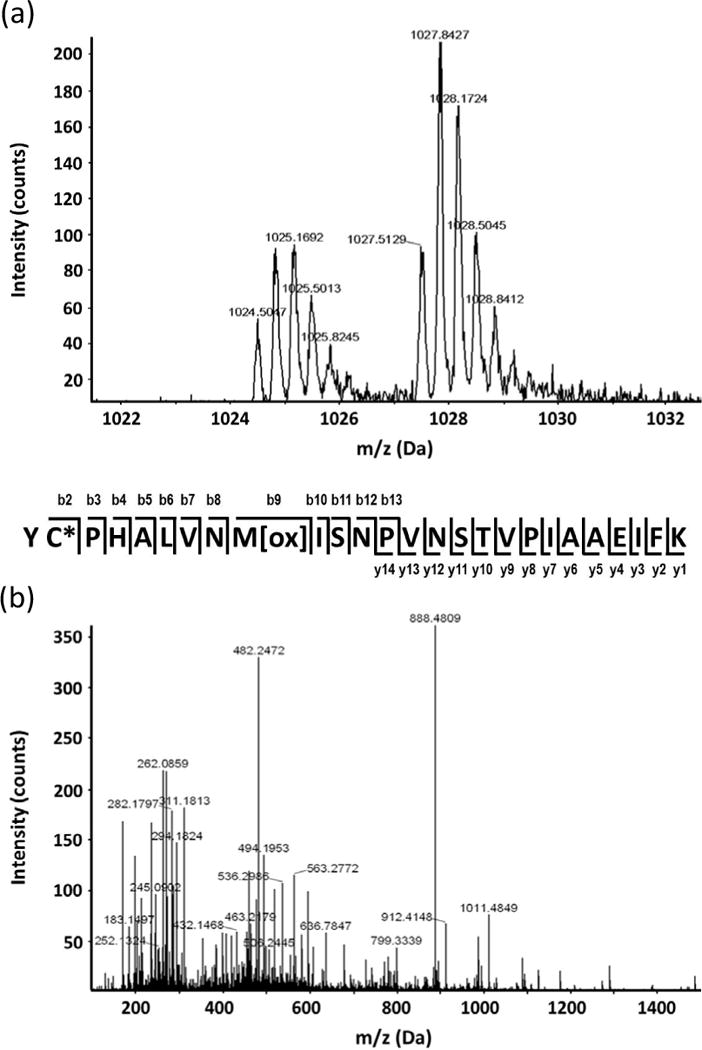
Figure 3.

Example of redox protein identification and cysteine mapping using the ICAT approach. (a) MS spectrum showing relative quantitation of a peptide derived from mitochondrial malate dehydrogenase (gi899226). (b) Peptide MS/MS spectrum with continuous series of b and y ions for confident identification.
