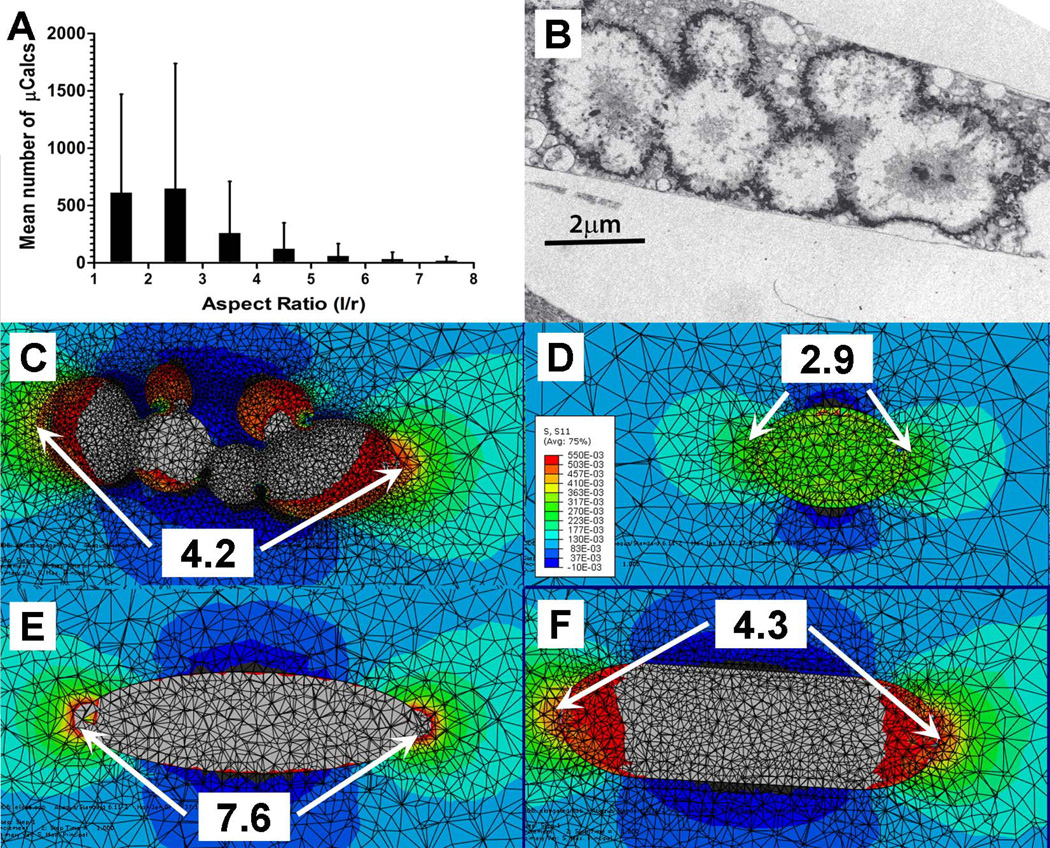
Figure 7.
Simplified FEA model was used to investigate the effect of complex boundary shapes of agglomerated µCalcs on SCF. (A) distribution of µCalcs in the fibrous cap by aspect ratio, (B) TEM image of aggregated calcifying matrix vesicles forming µCalcs in a mouse atheroma, (C) original boundary shapes of agglomerated µCalcs in panel B, (D) a simplified model geometry in which the radii of curvature at the poles were maintained, (E) an equivalent ellipsoid with same major and minor axes as the µCalc, but without maintaining the particle curvature at the poles, (F) same major length of the particle and its curvature at the poles of the µCalc. Numbers show calculated stress concentration factor at the poles.

