. Author manuscript; available in PMC: 2015 May 1.
Published in final edited form as: Bioorg Med Chem Lett. 2014 Mar 20;24(9):2193–2197. doi: 10.1016/j.bmcl.2014.03.016

Table 2.

IC50 values for diadamantyl-based sEH inhibitors 2a–d, 3a–d and 4a–b*

graphic file with name nihms577781u2.jpg
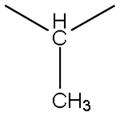
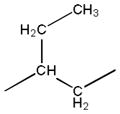
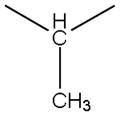
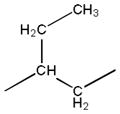
# X Z IC50 (nM)a mp (°C)
2a - graphic file with name nihms577781t3.jpg 7.2 251.1–253.4
2b graphic file with name nihms577781t4.jpg graphic file with name nihms577781t5.jpg 1.2 257.1–258.9
2c graphic file with name nihms577781t6.jpg graphic file with name nihms577781t7.jpg 2.3 210.9–213.7
3a - graphic file with name nihms577781t8.jpg 997 256.3–257.8
3b graphic file with name nihms577781t9.jpg graphic file with name nihms577781t10.jpg 0.5 191.8–192.9
3c graphic file with name nihms577781t11.jpg graphic file with name nihms577781t12.jpg 1440 130.1–131.4
4a - graphic file with name nihms577781t13.jpg 19.5 362.4–364.1
4b graphic file with name nihms577781t14.jpg graphic file with name nihms577781t15.jpg 161 285.2–286.1
graphic file with name nihms577781t16.jpg
2d - graphic file with name nihms577781t17.jpg 10.4 274.2–276.0
3d - graphic file with name nihms577781t18.jpg 2.6 254.6–255.4
a

As determined via a kinetic fluorescent assay.25