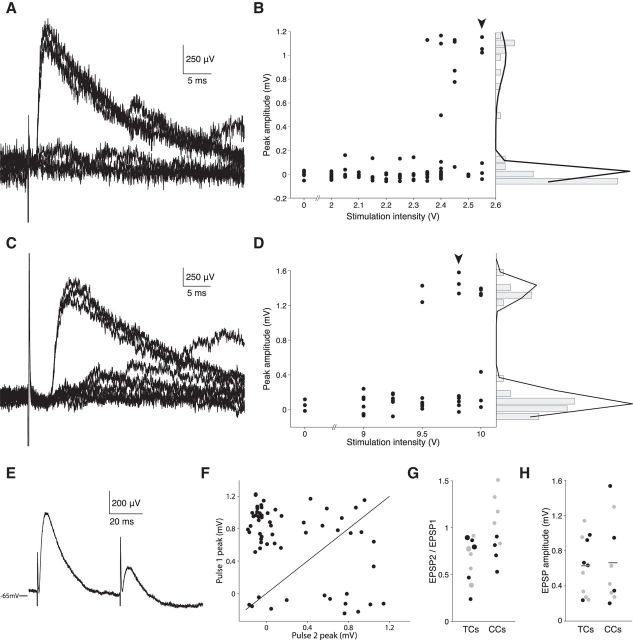
Figure 10.
Unitary TC and CC inputs are equally potent when measured in vivo. A, Somatic voltage recorded during 7 trials of a L4 spiny stellate neuron in response to a 2.55 V stimulus delivered to the white matter under the neuron's barrel column in an adult rat. The stimulus results in successful synaptic transmission 50% of the time. B, As the intensity of the stimulus is increased from 2 to 2.55 V (left), trials generated progressively more successes with relatively constant EPSP amplitude. Stimulus intensity was randomized during acquisition, but ordered in this plot for clarity. Zero (0) indicates no stimulus; arrowhead indicates the stimulus intensity used to obtain the traces shown in A. Histogram of the EPSP peak amplitude shows a bimodal distribution (right); black line indicates a fit using a double Gaussian function (μ1 = 0.004 mV, σ1 = 0.047 mV, μ2 = 1.00 mV, σ2 = 0.198 mV). C, D, Same as for A and B, but in a young animal, stimulating in L2/3. μ1 = 0.087 mV, σ1 = 0.102 mV, μ2 = 1.383 mV, σ2 = 0.091 mV. E, Paired pulses in white matter (20 Hz) reveal pronounced short-term depression (mean of 60 trials). F, Peak amplitudes of EPSPs evoked by paired pulses reveal dual successes of synaptic transmission (top right quadrant), dual failures (bottom left quadrant), a preponderance of successes on the first stimulus only (top left quadrant), or a minority of successes on the second stimulus only (top right quadrant). Black line indicates identity. G, EPSP2/EPSP1 ratio for paired pulses at 20 Hz (large circles: 10 Hz) recorded in adult (black) and juvenile (gray) rats. H, Summary of the unitary EPSP amplitudes recorded in adult (black) and juvenile (gray) rats. Lines indicate the means.

