
Figure 8.
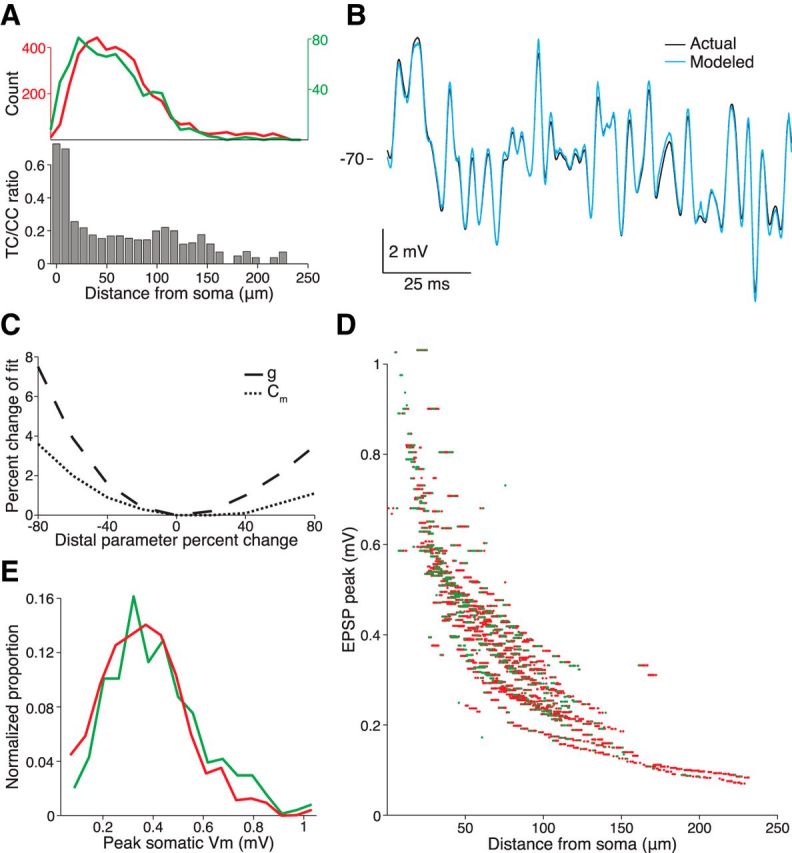
Compartmental model predicts that relative TC proximity to the soma does not render this class of inputs stronger. A, Top, TC (green) and CC (red) spine density for cell 6 (shown in Fig. 7A). Bottom, Ratio of TC to CC spines declines as a function of distance from the cell soma. B, Voltage responses of actual cell (black) to somatic injection of pink noise current and the fitted model (blue) to the same current injection. A compartmental model based on the volumetric morphology (shown in Fig. 7A) and the voltage response were used to constrain the fit of three biophysical parameters (axial resistance, specific conductance, and specific capacitance). C, Percent change in mean squared error (MSE) of the model's fit when varying the specific membrane conductance and capacitance (g and Cm, respectively) in four short, distal terminal dendrite segments of the cell's 48 segments. D, Individual EPSP peaks measured at the soma resulting from a synaptic conductance injected into the compartmental model at the 4154 CC and 743 TC spine locations (green and red, respectively). E, Distributions of simulated somatic EPSP peaks for the two classes of inputs shown in D.