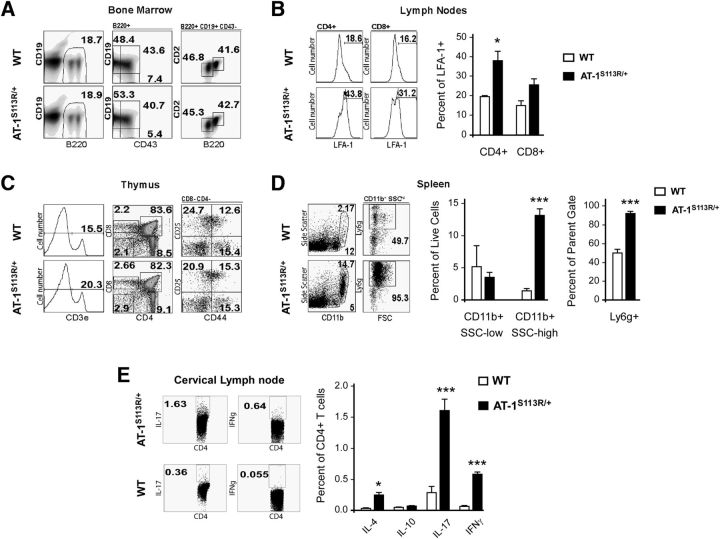
Figure 5.
Phenotypic characterization of the immune system. A, Dot plots showing frequency of B220+ B-cell precursors in bone marrow including: pre-pro B cells (CD43+CD19−), pro-B cells (CD43+CD19+), pre-B cells (CD43−CD19+CD2−B220int), and mature B cells (CD43−CD19+CD2+B220high). B, Representative histograms showing the percentage of cells expressing the activation marker LFA-1 on CD4+ and CD8+ cells isolated from lymph nodes (summarized in bar graphs). C, Representative dot plots showing frequency of T-cell precursors in thymus. CD4−CD8− double-negative (DN) cells were subdivided into developmental stages DN1 (CD44+CD25−), DN2 (CD44+CD25+), and DN3 (CD44−CD25+). CD4+ and CD8+ single-positive populations are also shown, along with percentage of cells expressing the T-cell coreceptor CD3 (histogram). D, Frequency of granulocytic CD11bhighLy6g+SSChigh and monocytic CD11b+Ly6g−SSClow myeloid cells in the spleen. E, T-helper lineage-specific intracellular cytokine production among lymphocytes stimulated with anti-CD3 and anti-CD28 for 4–5 h. Representative dot plots show IL-17 (Th17) and IFNγ (Th1); IL-4 (Th2) and IL-10 (Treg) are not depicted. In all panels, values are the mean (n = 3) ± SD. *p < 0.05; **p < 0.005; ***p < 0.0005.

