Figure 8.

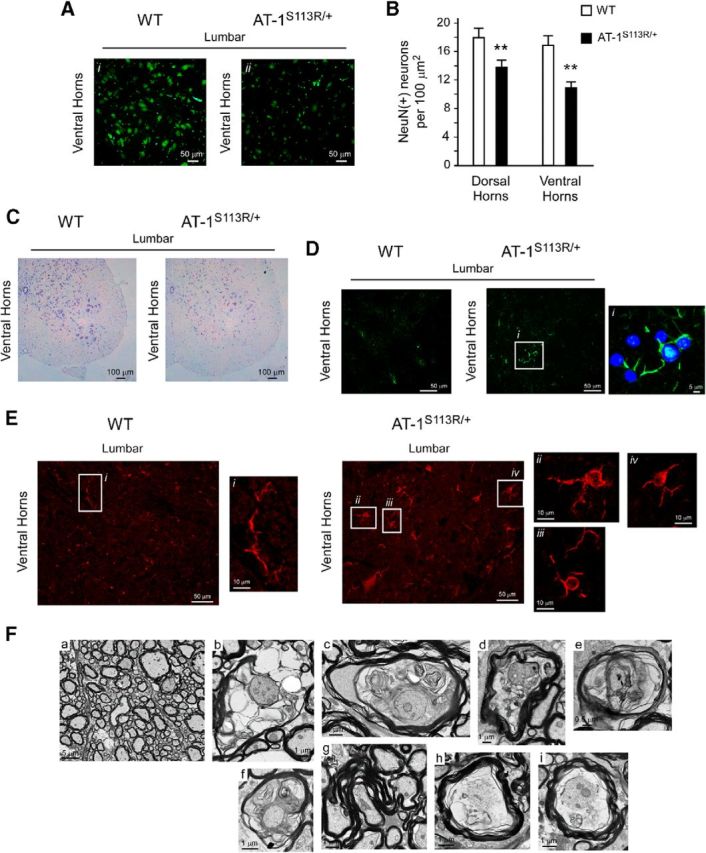
Neuronal loss and microglia activation in the spinal cords of AT-1S113R/+ mice. A, NeuN staining in the ventral horn of the spinal cord showing neuronal loss in AT-1S113R/+ mice. Representative images of the ventral horns of the lumbar section are shown. B, Computer-assisted quantification of NeuN(+) neurons per 100 μm2 section areas (n = 3 animals; 7 sections per animal). Error bars indicate SD. **p < 0.005. C, Nissl staining showing neuronal loss in AT-1S113R/+ mice. D, GFAP staining showing reactive astrocytes in AT-1S113R/+ mice. E, Iba1 staining showing microglia activation in AT-1S113R/+ mice. High-magnification insets show typical features of resting microglia in WT (left) and activated microglia in AT-1S113R/+ (right) mice. F, Electron microscopy showing myelin and axonal degeneration in the white matter of AT-1S113R/+ mice. Representative images of the lateral columns (lumbar section) are shown. a, WT; b–i, AT-1S113R/+. Selected degenerating features are shown in b–i, including vacuolar myelinopathy, myelin outfolds, degenerating and regenerating myelin, and axonal degeneration. Animals were 10–12 months old when studied.
