Figure 9.

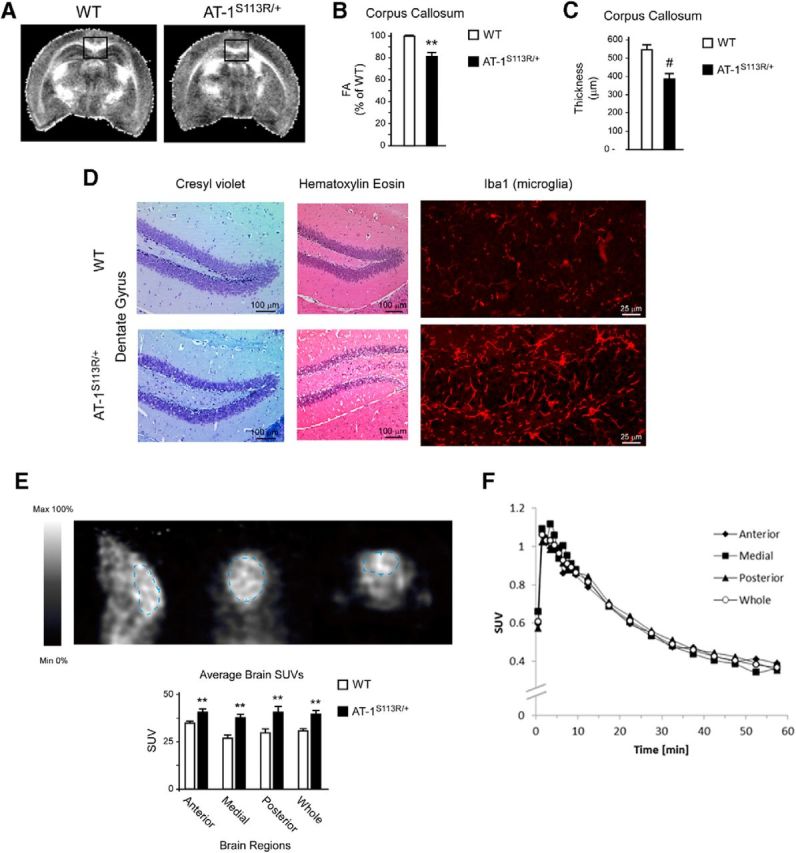
Loss of association fibers, gliosis, and microglia activation in the brains of AT-1S113R/+ mice. A, B, MRI imaging showing reduced FA of the corpus callosum in AT-1S113R/+ mice. Representative images are shown in A and FA changes are shown in B. Results are expressed as percentage of WT ± SD (n = 3 animals; 14 contiguous sections per animal). **p < 0.005. C, Thickness of the corpus callosum determined after Kluver–Barrera staining of consecutive coronal sections. Results are the average ± SD (n = 5 animals; 7 contiguous sections per animal). #p < 0.0005. D, Cresyl violet, H&E, and Iba1 staining showing gliosis and microglia activation in the dentate gyrus of AT-1S113R/+ mice. E, [11C]PBR28 PET imaging showing widespread microglia activation and inflammation of the brain in AT-1S113R/+ mice. Values are the mean ± SD (n = 4). **p < 0.005. F, No overall difference can be seen in the clearance of [11C]PBR28 from different brain regions. Animals were 10–12 months old when studied.
