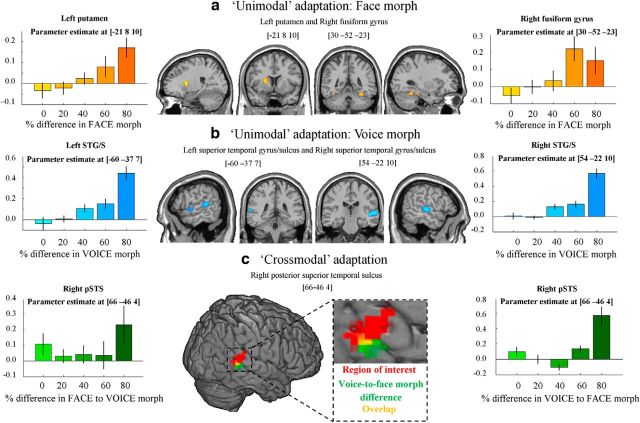
Figure 4.
Imaging results. a, Unimodal face adaptation. Activation in left putamen and right FG in response to varying percentage difference in face morph between consecutive stimuli. Left and right, Parameter estimate at the peak activated voxel of left putamen and right FG, respectively, as a result of varying percentage difference in face morph. Results were thresholded at p < 0.05 (FWE voxel corrected) and a minimum cluster size of more than five contiguous voxels. b, Unimodal voice adaptation. Activation in bilateral STG/STS in response to varying percentage difference in voice morph between consecutive stimuli. Left and right, Parameter estimate at the peak activated voxel in left and right STG/STS, respectively, as a result of varying percentage difference in voice morph. Results were thresholded at p < 0.05 (FWE voxel corrected) and a minimum cluster size of more than five contiguous voxels. c, Crossmodal adaptation. Red, Results from the independent functional multimodal localizer. An ROI analysis showed that voice-to-face emotion morph difference evoked a significant response in this region (p < 0.025, t = 2.12). Green, Activation in right pSTS as a result of varying percentage difference between voice and the following face morph of consecutive stimuli. Results were thresholded at p < 0.001 (voxel uncorrected) with a minimum cluster size of more than five contiguous voxels. Yellow, Overlap between the localizer and voice-to-face morph difference activation. Left and right, Parameter estimate at the peak activated voxel of right pSTS as a result of varying percentage difference in face-to-voice morph, and voice-to-face morph, respectively. It should be noted that face-to-voice morph difference did not evoke a significant response in this region.

