
Figure 2.
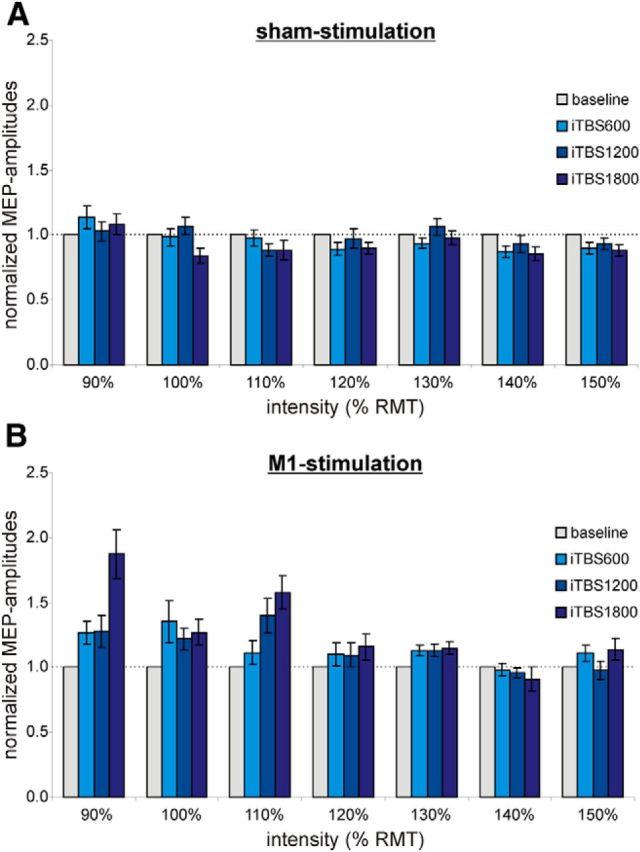
Main experiment: MEP amplitudes normalized to baseline (gray) at different stimulation intensities relative to the RMT. A, sham stimulation. B, M1 stimulation. Dose-dependent iTBS aftereffects seem to be more pronounced at near-threshold stimulation intensities (90%–110% of the RMT) compared with higher stimulation intensities (120%–150% of the RMT).