Figure 4.
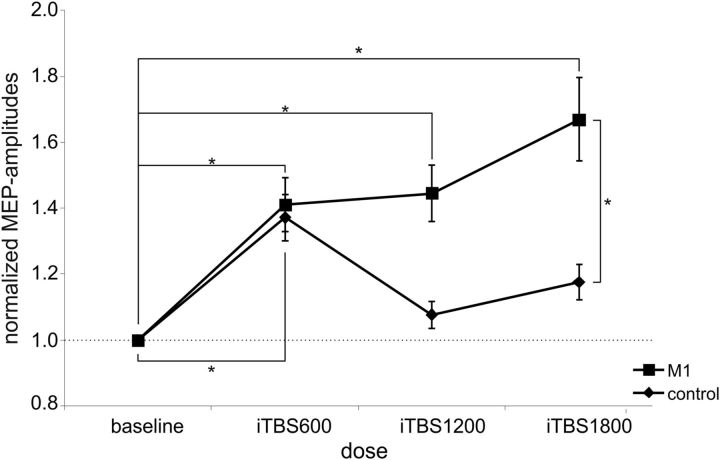
Supplemental control experiment: M1 versus supplemental control stimulation. Changes in MEP amplitudes after M1 (squares) and supplemental control stimulation (diamonds), normalized to baseline MEP amplitudes. *Significant aftereffects after M1-iTBS compared with supplemental control stimulation or baseline (p ≤ 0.05, Student's t test). One stimulation over M1 in the supplemental control experiment led to comparable results as obtained after M1-iTBS600 in the main experiment. After three blocks of iTBS over M1 (M1-iTBS1800), MEP amplitudes were significantly higher compared with one M1 stimulation followed by two stimulations over the parieto-occipital vertex.

