
Figure 5.
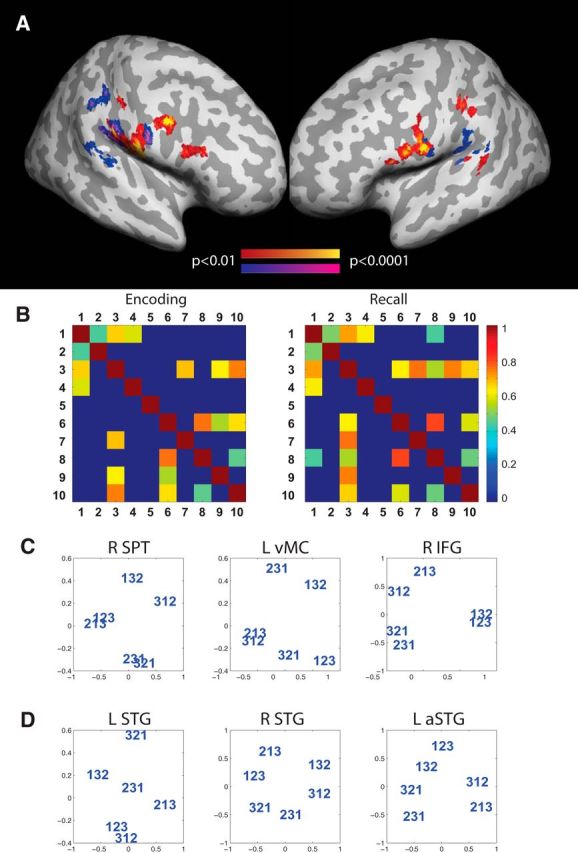
Order information. Regions where the similarity of activity patterns were predicted by the Hamming distance significantly above chance across participants. A, Encoding phase of the task: red–yellow; recall phase of the task: navy–magenta. B, Correlation of order information between different brain areas during the encoding and recall phases: (1) L-vMC, (2) R-IFG, (3) L-SPT, (4) L-IFG, (5) L-IPL, (6) L-SMG, (7) L-IFG, (8) R-SMG, (9) R-IPL, and (10) R-vMC. Only correlations for which p < 0.001 are shown. C, The similarity structure of fMRI activity patterns elicited by different orderings in three ROIs that encoded positional item-order associations. The similarity structure was visualized by performing nonmetric multidimensional scaling (in two dimensions) on the dissimilarity matrix of the multivoxel patterns evoked by all orderings using MATLAB's mdscale function. D, Similarity structure for three ROIs which encoded only item information and where not significantly correlated with the positional model prediction.