Figure 6.
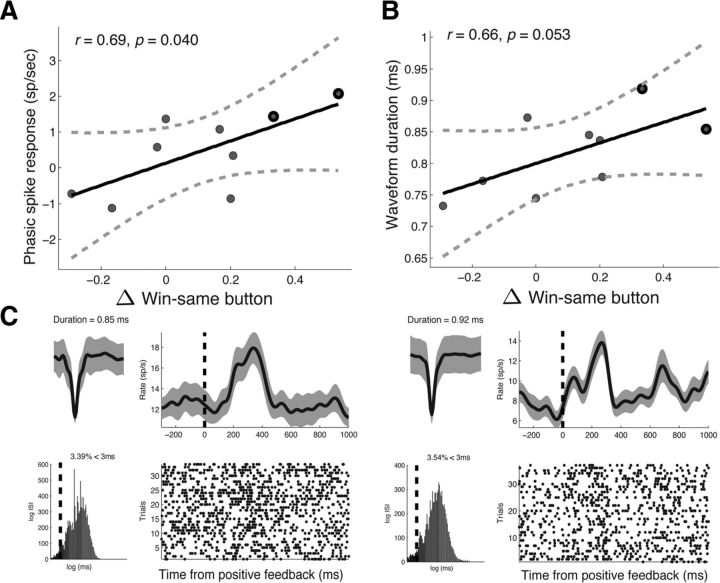
Relation between stimulation-related action bias and recorded neural activity. A, B, Stimulation-related increases in win-same button were positively correlated with postreward phasic responses (A) and the mean waveform duration (B) of multiunit activity recorded during Stage 1. Each dot represents a subject, the solid black line is the regression slope, and the dashed lines represent 95% confidence intervals. Nine of the 11 subjects contributed to this analysis (we were unable to obtain recordings from Subject #3 and we did not identify spiking activity from Subject #11; see Materials and Methods). C, Example waveforms and postreward phasic responses of unit activity from the two subjects who showed the greatest increases in win-same button (outlined in black in A and B). For each unit, we show the average waveform (top left, gray shading marks the SD), the interspike interval (bottom left, black line marks 3 ms), the average postreward firing response (top right, smoothed with a Gaussian kernel of half-width = 75 ms; gray shading indicates SE of mean), and the spike raster after reward trials. Dashed black line indicates reward onset.

