
Figure 3.
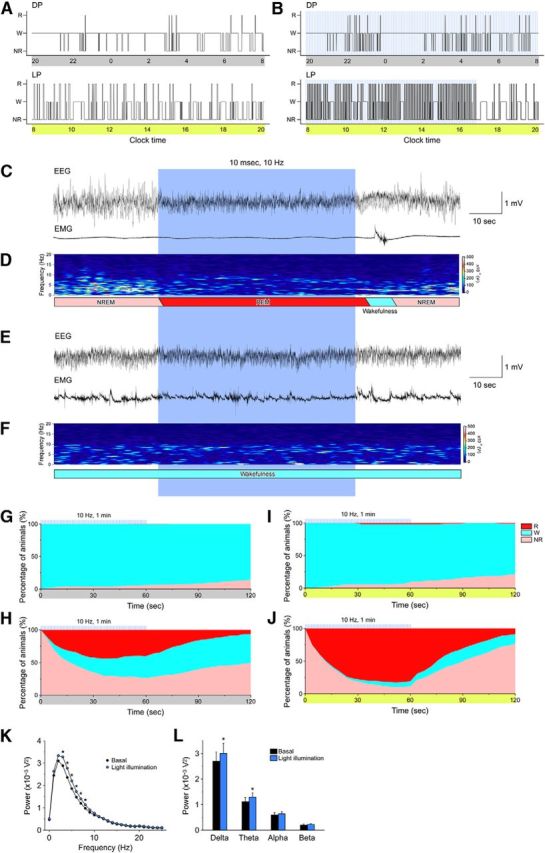
Acute activation of MCH neurons induces transitions from NREM sleep to REM sleep. A, B, Representative hypnograms of (A) no illumination and (B) blue light illumination for 1 min every 5 min (25.8 mW/mm2, 10 ms, 10 Hz) from 20:00 to 16:46. The upper panel is the dark period (20:00–8:00); lower panel is the light period (8:00–20:00); blue bars indicate 1 min periods of blue illumination. C, E, Representative traces for EEG (upper trace) and EMG (lower trace). Blue pulses were applied during NREM sleep (C) or wakefulness (E). D, F, EEG power spectra corresponding to C and E. G–J, Graphs show percentage of animals in each vigilance state during blue pulse illumination. G, H, Dark period. I, J, Light period. Blue light illumination occurred during a waking period in G and I and during NREM sleep in H and J. The blue lines above each graph indicate 1 min blue light illumination pulses. K, Power spectral analysis of EEG in the light period (8:00–16:46) without illumination (black) and with illumination (blue). L, The average EEG power densities in the delta, theta, alpha, and beta wave bands in the light period (8:00–16:46). W, Wakefulness; R, REM sleep; NR, NREM sleep; LP, light period; DP, dark period. Values are represented as means ± SEM. *p < 0.05 versus no illumination.