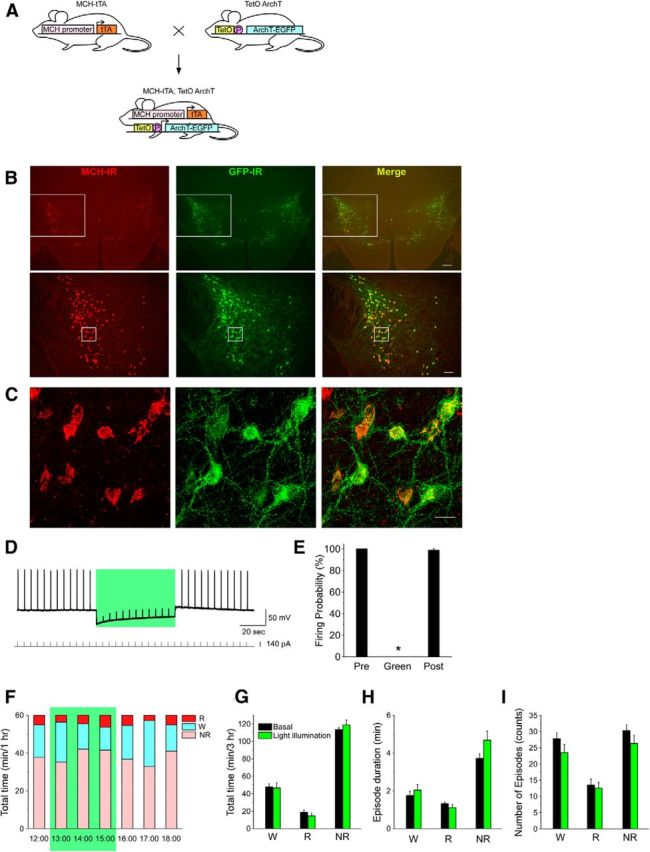
Figure 4.

In vivo optogenetic inhibition of MCH neurons has no effect on vigilance states. A, Schematic shows generation of bigenic MCH-tTA; TetO ArchT mice. P, Minimal promoter. B, C, Immunohistochemical analyses revealed that ArchT is specifically expressed in MCH neurons in the MCH-tTA; TetO ArchT bigenic mouse brain. B, MCH-immunoreactive (MCH-IR) neurons (left, red; Alexa594) and ArchT::GFP-immunoreactive (GFP-IR) neurons (middle, green; Alexa488) located in the LHA and the zona incerta. Right, Merged image shows specific expression of ArchT in MCH neurons. Bottom row are higher magnifications of the regions enclosed by the squares in the top row. Scale bars: (in top, right) top row, 200 μm; (in bottom, right) bottom row, 100 μm. C, Confocal microscopic image of the region indicated by the squares in B, bottom row. Scale bar, 20 μm. D, E, Slice patch-clamp recordings from MCH neurons. D, Upper trace, Current-clamp recording from MCH neuron. Lower trace, Injected current through the recording electrode (0.2 Hz, 140 pA, 100 ms) to generate action potentials. Green light illumination (549 ± 7.5 nm, 0.9 mW, 1 min) inhibited firing elicited by current injection. E, Bar graph indicating the firing probability calculated from the data in D (n = 7). Firing probability is normalized to the 1 min before light illumination (Pre). Green light was applied for the duration indicated by the green bars. Values represent means ± SEM. *p < 0.05 versus Pre. F, Green light illumination (542 ± 13.5 nm, 33.4 mW/mm2, 3 h from 13:00 to 16:00) in the light period. G–I, Bar graphs indicating the total time in each vigilance state (G), episode duration (H), and number of episodes (I) during green light illumination. W, Wakefulness; R, REM sleep; NR, NREM sleep. Values are represented as means ± SEM. *p < 0.05 versus basal (no illumination).
