
Figure 1.
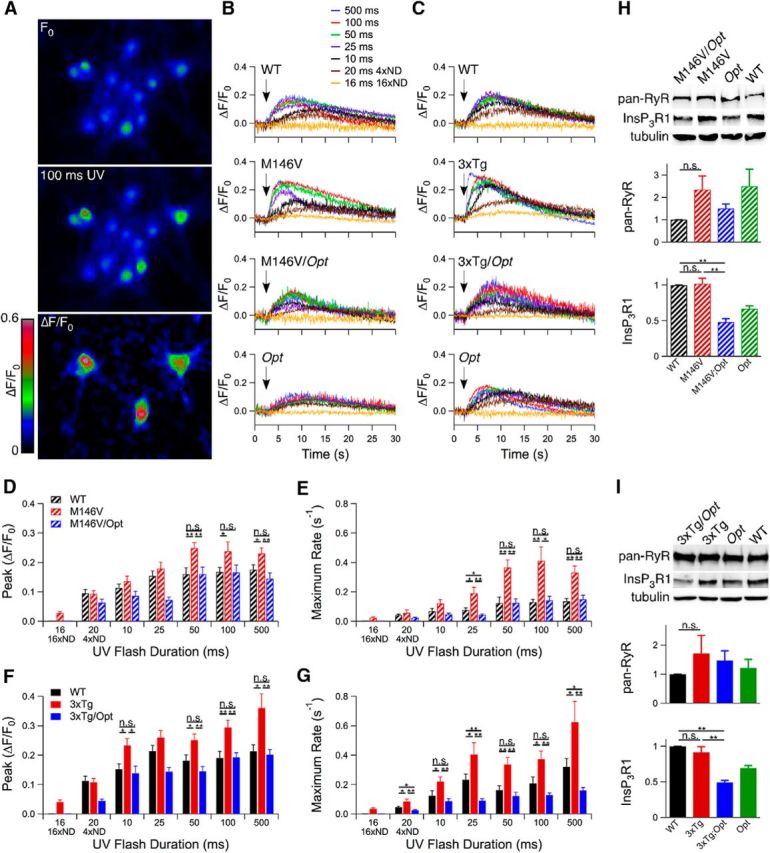
Oregon Green Ca2+ imaging in PCNs loaded with caged InsP3. A, After obtaining a baseline recording (F0), a 100 ms UV pulse was applied. B, C, Representative single cell traces of each genotype after UV illuminations (indicated by arrows) ranging from ∼1–500 ms. Stimulus strength was regulated by pulse duration and use of neutral density (ND) filters. D–G, Magnitudes (D, F) and rates (E, G) of Oregon Green fluorescence change after UV illumination. Unpaired two-tailed t test, n = 10–186 responding neurons from three embryos each per flash duration, *p < 0.05, **p < 0.005. H, I, InsP3R1 and RyR protein levels in PCNs from M146V (n = 4 mice each; H) and 3xTg (n ≥ 5 mice each; I) lines, and tubulin as a loading control. Unpaired two-tailed t test, p < 0.005. Error bars show mean and SEM.