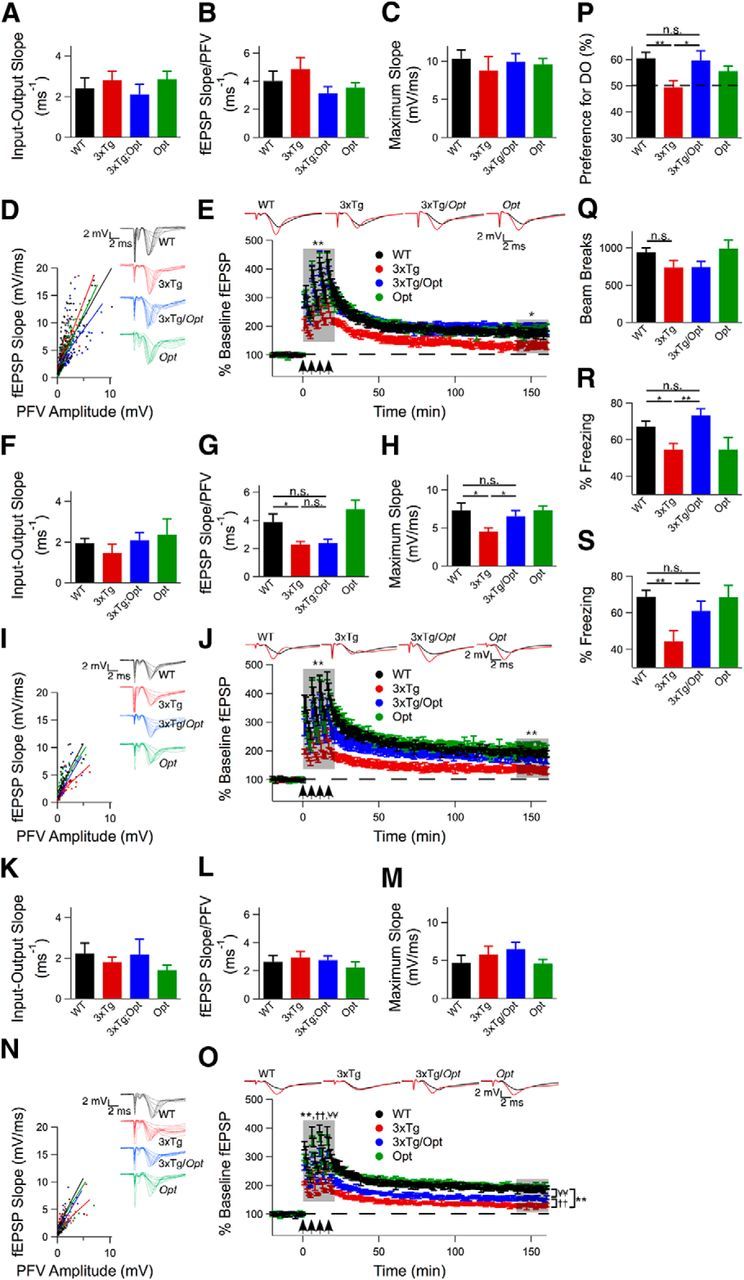
Figure 9.

The Opt allele delays the onset and attenuates the severity of hippocampal deficits in 3xTg mice. A–D, Basal synaptic transmission in 6-month-old mice as measured by the slope of the input-output curve, the ratio of the fEPSP slope to the PFV amplitude at each applied voltage, and the maximum evoked fEPSP slope. Unpaired 2-tailed t test, n ≥ 7 mice each, no significant differences observed. E, LTP in hippocampal CA1 of 6-month-old mice induced by 4 100 Hz, 1 s tetani with 5 min interstimulus interval applied at t = 0. The average baseline fEPSPs (black) and those recorded during the last 20 min (red) are presented. Comparisons made over first 20 min after tetani and over the last 20 min of the recording. Repeated-measures ANOVA, n ≥ 5 mice each, *p ≤ 0.05, **p ≤ 0.005. F–I, Basal synaptic transmission in 9-month-old mice as measured by the slope of the input-output curve, the ratio of the fEPSP slope to the PFV amplitude at each applied voltage, and the maximum evoked fEPSP slope. Unpaired 2-tailed t test, n ≥ 5 mice each, p ≤ 0.05. J, LTP in hippocampal CA1 of 9-month-old mice induced by 4 100 Hz, 1 s tetani with 5 min interstimulus interval applied at t = 0. The average baseline fEPSPs (black) and those recorded during the last 20 min (red) are presented. Comparisons made over first 20 min after tetani and over the last 20 min of the recording. Repeated-measures ANOVA, n ≥ 5 mice each, p ≤ 0.005. K–N, Basal synaptic transmission in 12-month old mice as measured by the slope of the input-output curve, the ratio of the fEPSP slope to the PFV amplitude at each applied voltage, and the maximum evoked fEPSP slope. Unpaired two-tailed t test, n ≥ 5 mice each, no significant differences observed. O, LTP in hippocampal CA1 of 12-month-old mice induced by 4 100 Hz, 1 s tetani with 5 min interstimulus interval applied at t = 0. The average baseline fEPSPs (black) and those recorded during the last 20 min (red) are presented. Comparisons made over first 20 min after tetani and over the last 20 min of the recording. Repeated-measures ANOVA,n ≥ 5 mice each, p ≤ 0.005. P, Percentage preference for the DO during spatial object recognition testing of 12- to 13-month-old mice. Dotted line indicates 50% (chance) preference. Unpaired 2-tailed t test, n ≥ 14 mice for WT, 3xTg and 3xTg/Opt, n = 7 mice for Opt, *p ≤ 0.05, **p ≤ 0.005. Q, Ten-minute open-field test conducted on 12- to 13-month-old mice to measure mobility. Unpaired 2-tailed t test, n ≥ 16 mice for WT, 3xTg and 3xTg/Opt, n = 7 mice for Opt, no significant differences observed. R, S, Percentage time spent freezing during a 3 min contextual fear-conditioning probe trial (R) and a cued fear-conditioning probe trial (S). Unpaired 2-tailed t test, n ≥ 13 for WT, 3xTg and 3xTg/Opt, n = 7 for Opt), *p ≤ 0.05, **p ≤ 0.005. Error bars show mean and SEM.
