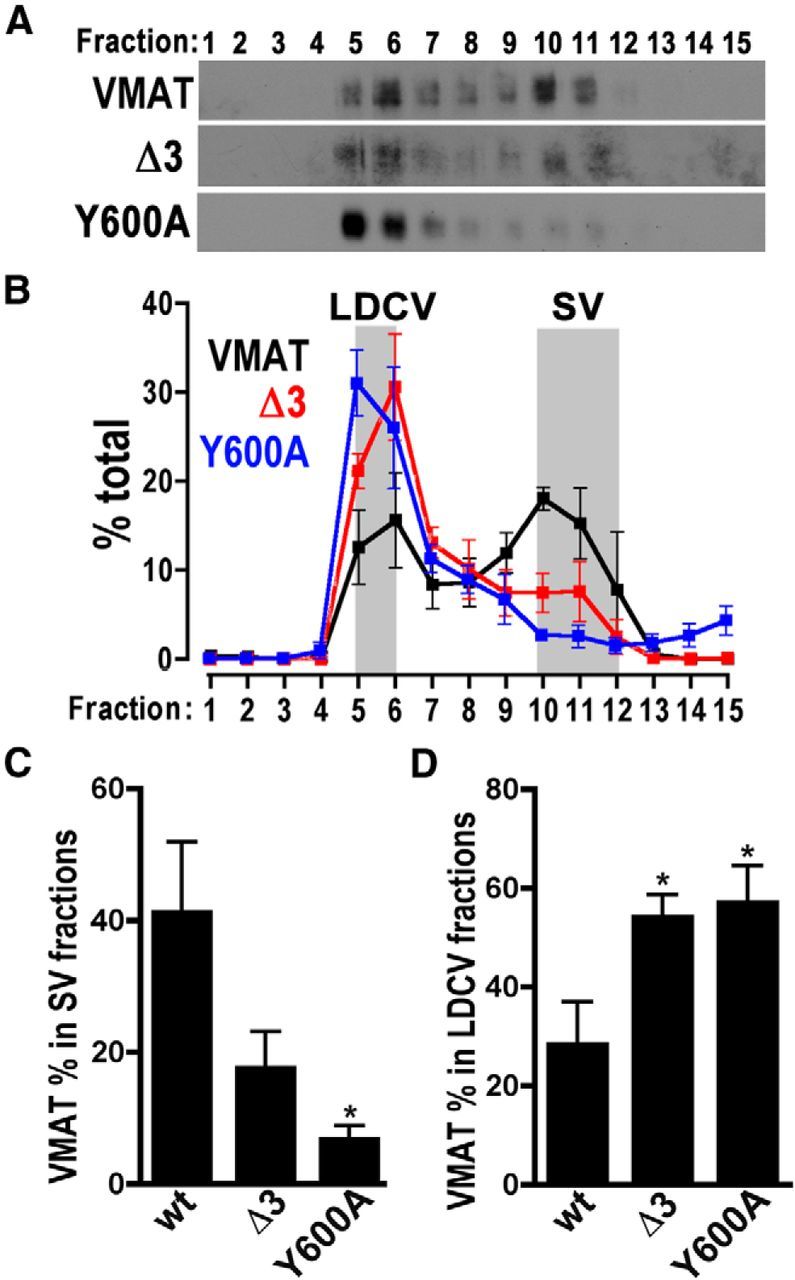
Figure 5.

Sucrose density gradients of wt and mutant DVMAT expressed in octopaminergic neurons. A, Representative Western blots show sucrose gradients of homogenates from fly heads expressing DVMAT-wt, DVMAT-Δ3, or DVMAT-Y600A, as indicated, using the Tdc2-Gal4 driver. B, Quantification of immunoblots (n = 3–5 per genotype) for DVMAT-wt, DVMAT-Δ3, and DVMAT-Y600A, as indicated. Compared with that of DVMAT-wt, HA immunoreactivity representing DVMAT-Δ3 and DVMAT-Y600A is shifted to fractions that contain LDCVs. Shaded bars show the position of markers for SVs and LDCVs. C, D, Total immunoreactivity representing DVMAT differed between genotypes for SV-containing fractions (C, ANOVA, p = 0.035, Dunnett's multiple-comparison test vs wt, *p < 0.05) and LDCV-containing fractions (D, ANOVA, p = 0.03, Dunnett's multiple-comparison test vs wt, *p < 0.05, as indicated).
