
Fig. 2.
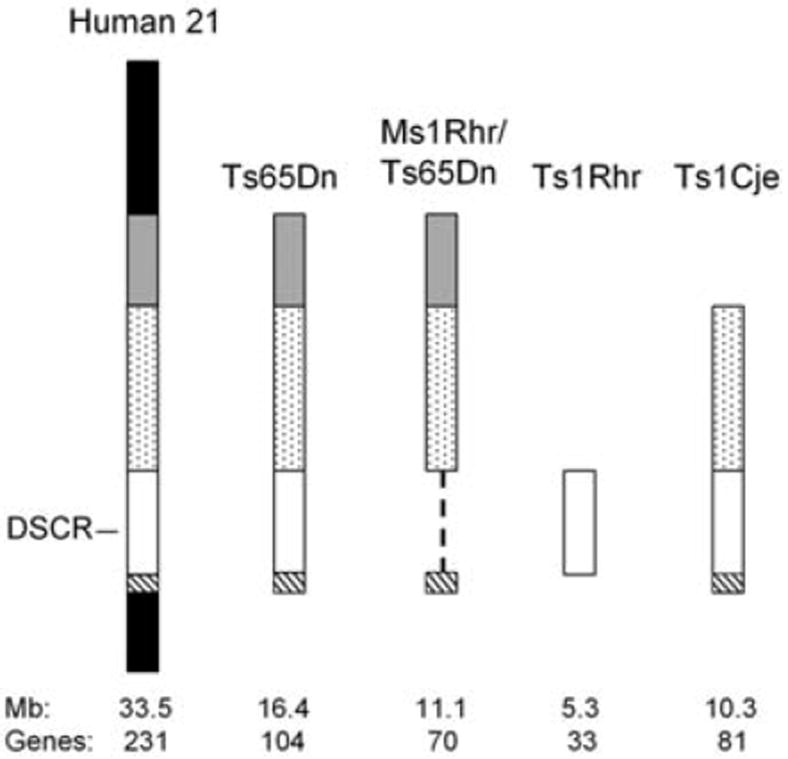
Trisomic segments represented in mouse models relative to HSA21. The DSCR is indicated as an open box where it is present and by a dashed line where it is deleted. Approximate size in megabases of triplicated information is based on genomic sequence; gene number is from Gardiner et al. (11). Gene content for each segment is given in table S1.