Fig. 5.

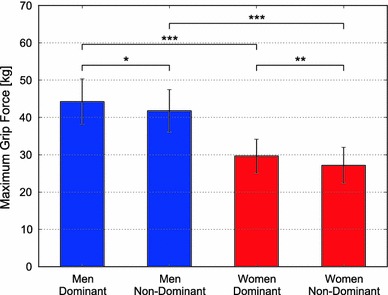
Comparison of the mean and standard deviation of the maximum grip forces of the dominant and non-dominant hands of men and women. Result of t test: *p < 0.05, **p < 0.01, ***p < 0.001

Comparison of the mean and standard deviation of the maximum grip forces of the dominant and non-dominant hands of men and women. Result of t test: *p < 0.05, **p < 0.01, ***p < 0.001