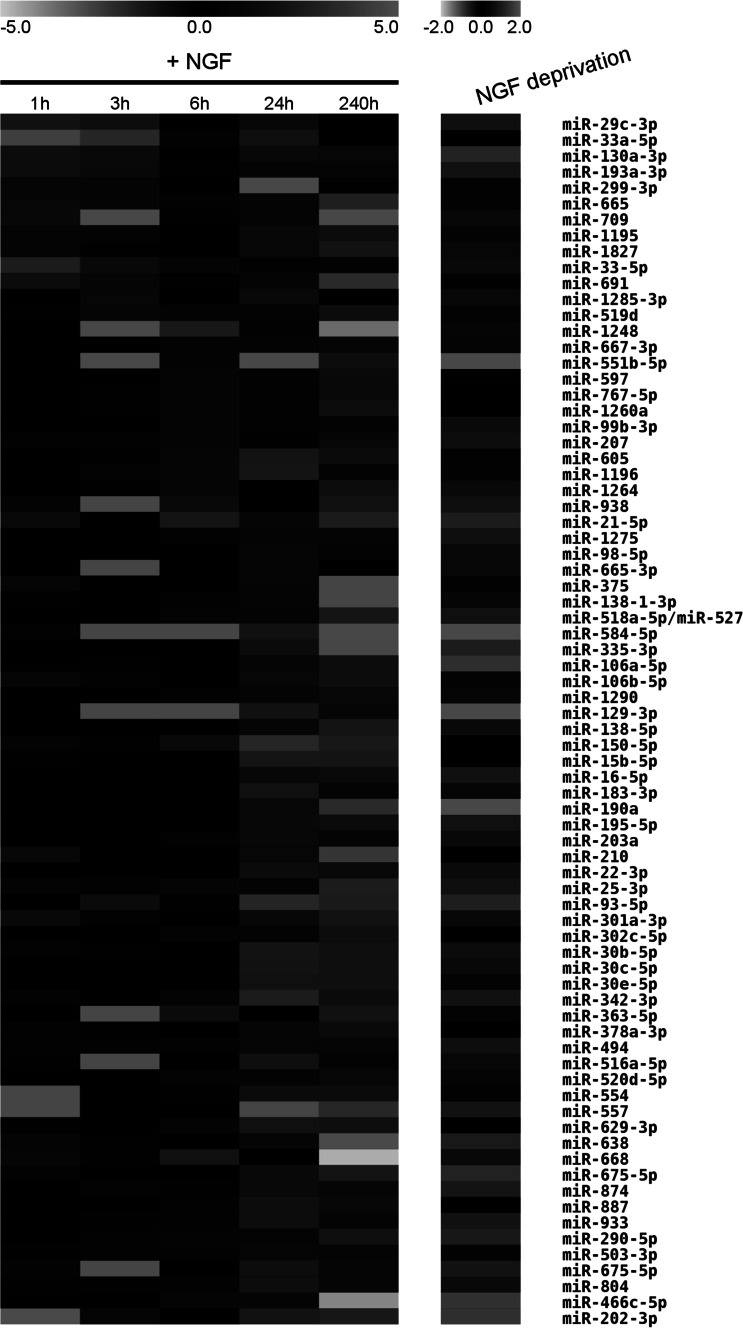
Fig. 1.
MicroRNAs modulated by Ngf in PC12 cells. Expression values of microRNAs modulated by Ngf are represented as heat map. The left image (+Ngf) shows microRNAs differentially expressed in PC12 cells at 1, 3, 6, 24 h and 10 d of Ngf treatment, relative to cells untreated with Ngf. The image on the right (Ngf deprivation) refers to microRNA expression in PC12 cells that were treated with Ngf for 10 days and then deprived of Ngf for 24 h, relative to cells treated with Ngf for 10 days but not deprived of Ngf. Only microRNAs modulated by Ngf in at least one condition are shown. Red and green indicate, respectively, increased or decreased expression relative to controls; black indicates no expression change; gray indicates that microRNA expression was undetected. Only miR expression values satisfying the threshold criteria—p value ≤0.05 in two-tailed Student’s t test; fold change ≤−1.7 or ≥1.7—are reported

