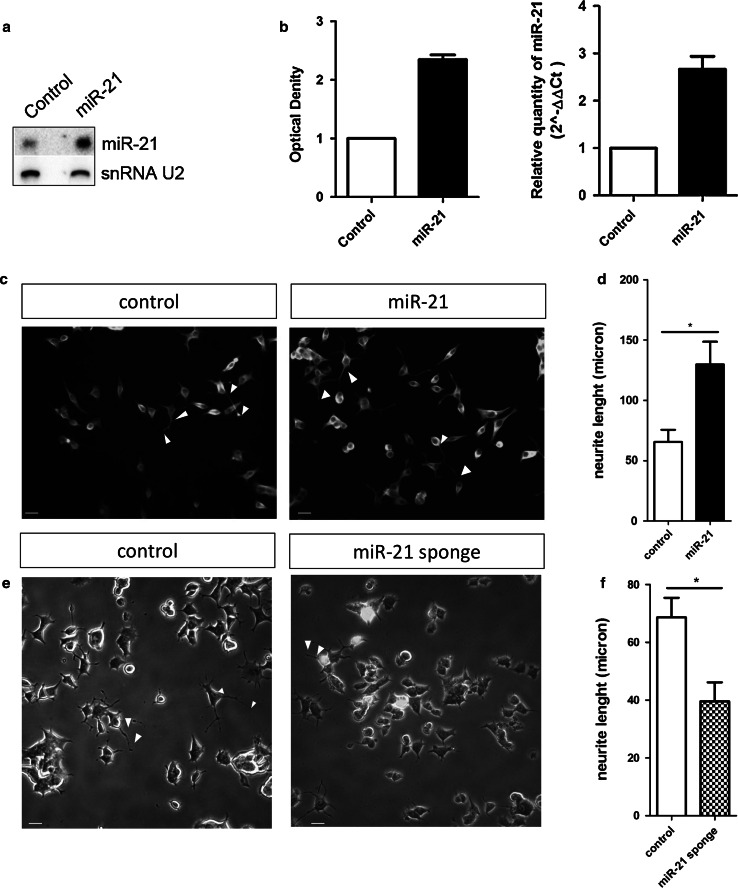
Fig. 3.
MiR-21 promotes PC12 cell differentiation in response to Ngf. a–b MiR-21 expression in PC12 cells transduced with miR-21 expressing (miR-21) or control lentivirus. a Representative Northern blotting. b Histograms showing miR-21 expression—relative to control cells set to a value of 1—measured by Northern blotting (left) and real-time PCR (right). Northern blotting data are presented as mean ± s.e.m. of two independent experiments; U2 snoRNA was used as loading control. Real-time PCR data are presented as mean ± s.e.m. of triplicate samples, from two biological replicates; U6 snoRNA was used as loading control. c–d Neurite length of PC12 cells ectopically expressing, or not, miR-21 and stimulated for 2 days with Ngf. c Immunofluorescence staining of α-tubulin. Scale bar 30 μm. d Histogram showing the average length of axons, expressed in μm. Data are represented as means ± s.e.m. of triplicate determinations of ten random fields in three independent experiments. *P value ≤0.05, according to Student’s t test. e–f Neurite length of PC12 cells transfected with a miR-21 sponge plasmid—harboring a destabilized EGFP with several miR-21 binding sites in the 3′ untranslated region –, stimulated for 2 days with Ngf, and fixed with 4 % PFA. e Photomicrographs. The green color represents EGFP; scale bar 30 μm. f The histogram shows neurite mean length, express in μm; data are represented as means ± s.e.m. of triplicate determinations of ten random fields in three independent experiments. *P value ≤0.05, according to Student’s t test

