
Fig. 1.
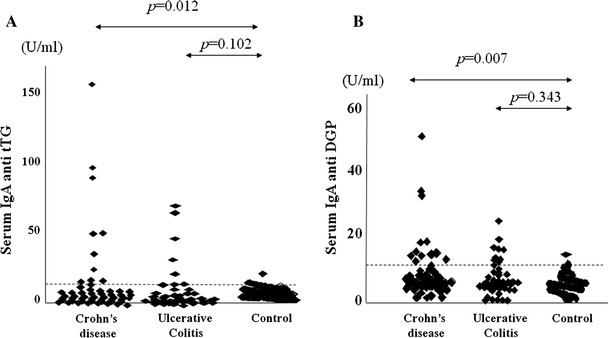
Serum concentration of celiac disease specific antibodies in IBD and control. Serum concentration of serum a tTG and b DGP in IBD and control. Dashed lines indicate the upper limit of normal level based on manufacturer’s provided cut-off values. The p values refer to the Mann-Whitney test calculated in IBD patients vs. controls 254 × 190 mm (96 × 96 DPI)