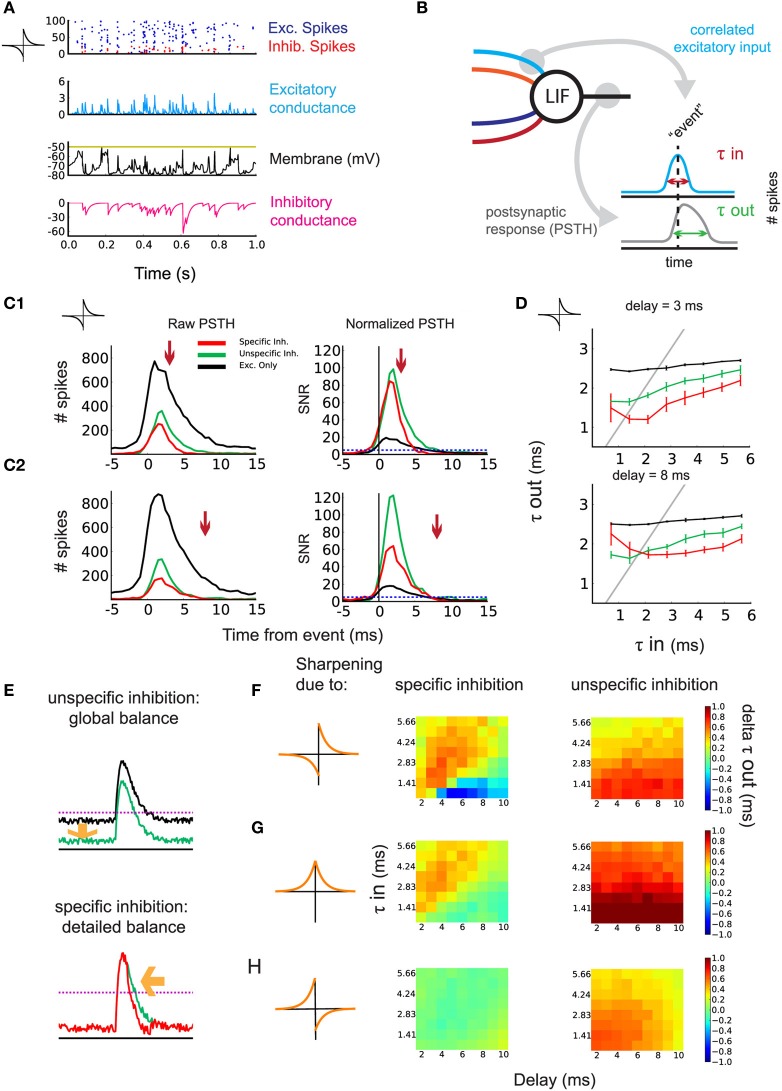
Figure 3.
Sharpening of the postsynaptic response by timed inhibition. (A) Neuronal state after learning. One second activity after training for the simulation in Figure 2B: raster plot of the input excitatory/inhibitory spikes (blue/red), excitatory/inhibitory conductance (blue/magenta), and voltage (black). (B) Schematic indicating the construction of the PSTH. Events are detected using the correlated excitatory inputs (blue). Then, postsynaptic spikes that occur in a given window around the event are counted (gray). Response efficiency is evaluated by the temporal width of the PSTH τout. (C1) Effect of inhibition on the response of the postsynaptic neuron to correlated events for τin = 2.12 ms and d = 3 ms. Left: example of raw PSTH for postsynaptic spike count. Comparison of detailed balance (red) with the control of global balance (green) and no inhibition (black). The arrow indicates incoming specific inhibition. Right: signal/noise ratio (SNR) obtained by normalizing the PSTHs. (C2) Same as in (C1) but with d = 8 ms. (D) Response sharpening for different values of τin and τout. The gray unit line represents instances where the output width and the input width are equal. Top: d = 3 ms. Bottom: d = 8 ms. Legend corresponds to (C). (E) schematic indicating the effect of detailed balance and global balance on the response shape. (F) anti-Hebbian iSTDP learning window and the contribution of detailed and global balance to the sharpening of the response. The difference in τout is shown for varying d (x-axis) and the input τin (y-axis). Left: difference in τout between detailed balance and global balance. Warm colors indicate the response is sharper through detailed balance compared to global balance. Right: difference in τout between global balance and no inhibition. (G) Same as in (D) but for symmetric iSTDP. (H) Same as in (D) but for Hebbian iSTDP, where no detailed balance emerged.

