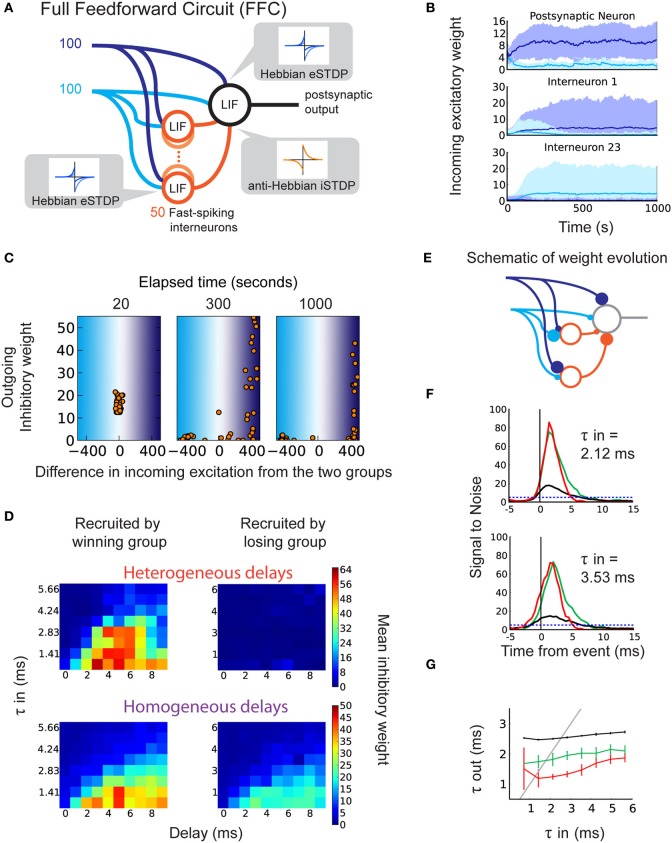
Figure 4.
Selection of delays in a disynaptic pathway by iSTDP. (A) Schematic representation of the full feedforward circuit model (FFC). The postsynaptic neuron receives excitatory input from two correlated groups that compete. Inhibition onto this neuron is provided via 50 fast-spiking interneurons (orange circles). Each interneuron receives inputs from both excitatory groups. The interneurons have axonal delays between 0 and 9 ms. All synapses are plastic, with learning windows shown by the insets. (B) The evolution of excitatory weights from the two input groups onto the output neuron (top) and onto two of the 50 interneurons (middle, bottom) in one example trial. Weights from group 1 (dark blue inputs) increase beyond those from group 2 (light blue inputs). Here, group 1 is the “winning group.” Interneuron 1 (23) receives more input from the dark (light) blue group. (C) Example of weight evolution onto interneurons and the subsequent change in inhibitory synaptic weights during the simulation (after 20, 300, 1000 s). Each dot represents one of the 50 interneurons. The x-axis indicates the difference in total weights between the two input groups onto the interneuron. The right (left) part corresponds to interneurons specializing to the dark (light) blue input group. The y-axis indicates the weight of the inhibitory synapse onto the postsynaptic neuron. (D) Inhibitory weights after learning depend on the axonal delays of interneurons (x-axis) and specialization of their input weights, in the FFC with heterogeneous delays (top; each horizontal line represents an average over 10 simulations), and in the FFC with homogeneous delays (bottom; each square represents 10 simulations). (E) Schematic of the recruitment of interneurons and the consequence on the inhibitory weights, leading to detailed balance. (F) SNR of the response to correlated events in the FFC with heterogeneous delays. Top: for τin = 2.12 ms. Bottom: for τin = 3.54 ms. (G) Relationship between τin and τout for the FFC model: specific inhibition (red), unspecific inhibition (green), and without inhibitory interneurons (black).

