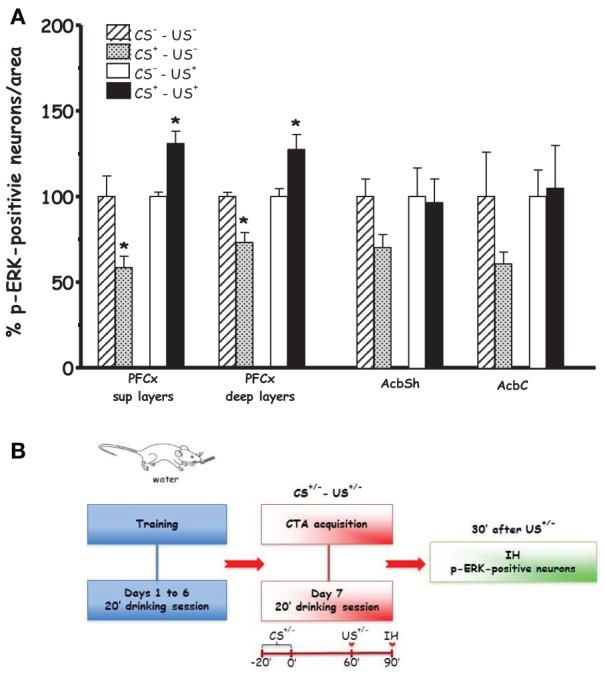
Figure 2.

Acquisition (Acq1) (A): Effect of CTA acquisition on % changes of p-ERK-positive neurons/area in the PFCx (superficial and deep layers) and Acb (shell and core). Data, average + s.e.m., are expressed as % changes with respect to the effect in control groups (CS−) set as 100%. *Indicates significant differences (p < 0.05) of % changes of p-ERK-positive neurons with respect to control groups (CS−-US− and CS−-US+) (One-Way ANOVA followed by LSD post-hoc test) (n = 4 in each group); (B): timeline schedule of Acq1 experiment.
