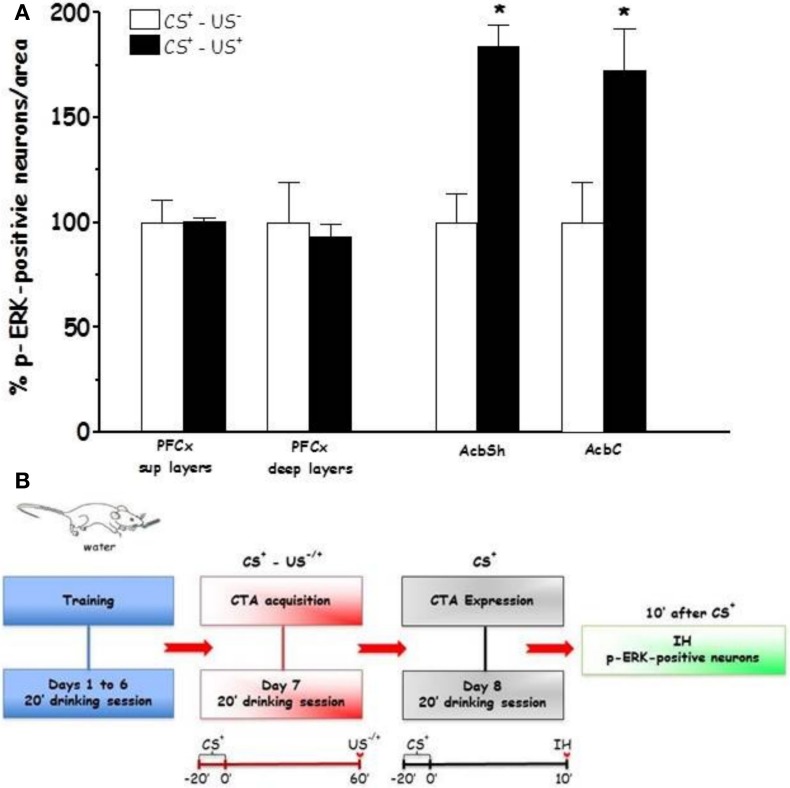
Figure 4.
Expression (Expr1) (A): Effect of CTA expression on % changes of p-ERK-positive neurons/area in the PFCx (superficial and deep layers) and Acb (shell and core). Data, average + s.e.m., are expressed as % changes with respect to the effect in control group (CS+-US−) set as 100%. Lithium chloride (LiCl, 125 mg/kg i.p., US+) or saline (i.p., US−) were administered on the last training day 1 h after the drinking session. Rats were sacrificed 30 min after the beginning of the expression test. *Indicates significant differences (p < 0.05) of % changes of p-ERK-positive neurons with respect to controls (CS+-US−) (One-Way ANOVA followed by LSD post-hoc test) (n = 4 in each group); (B): timeline schedule of Expr1 experiment.

