
Figure 4.
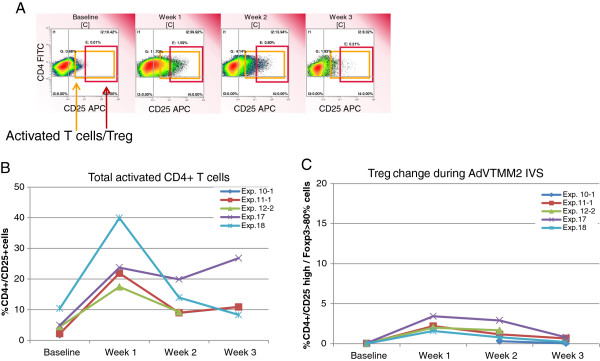
Total activated CD4+ T cells and Treg expanded in vitro. The cultured PBMC were tested weekly (without further stimulation) for the frequency of total activated CD4+ T cells (CD25+), and the subset which represent Treg (CD25hi+ and > 80% intracellular FoxP3+). The gating strategy for each population is shown (A), total activated CD4+ T cells are in (B) and Treg shown in (C).