
Figure 2. F-dependence of R(F)/R(0) for some selected  ω-values, indicated in the individual panels.
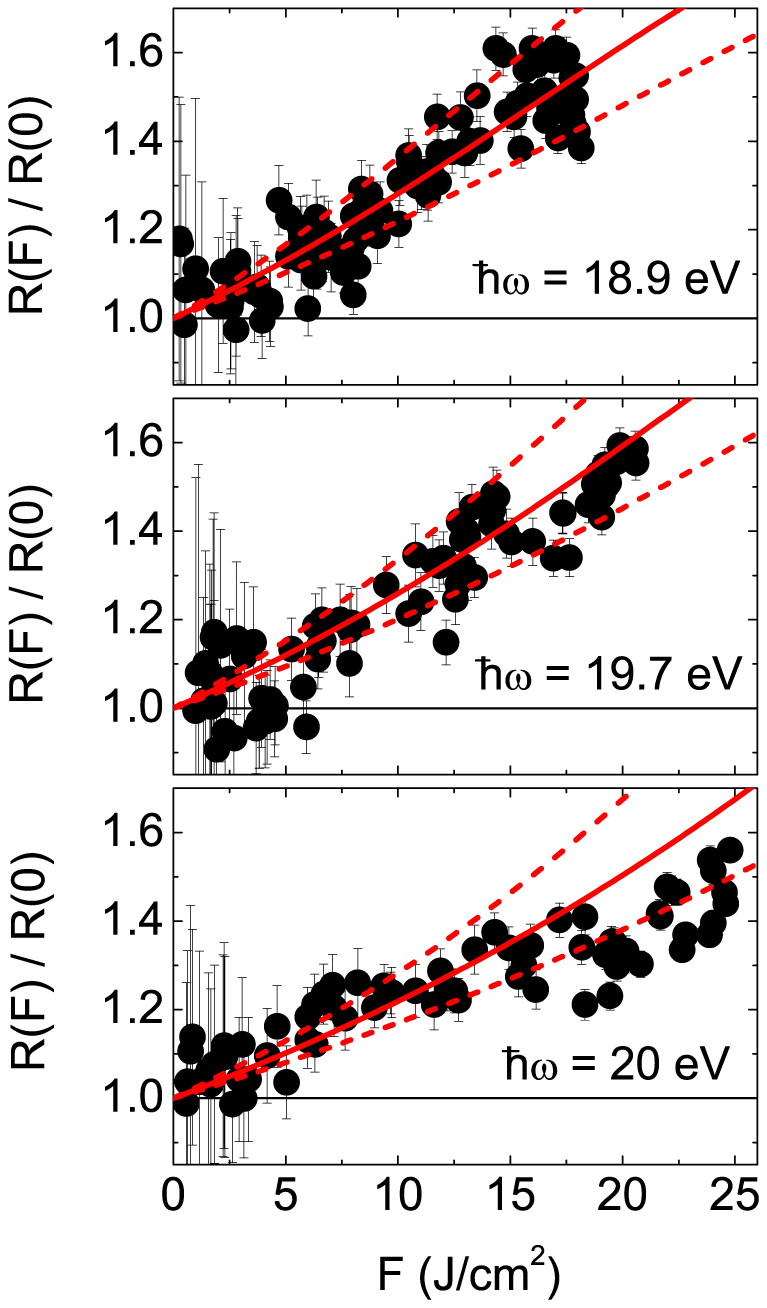
Each data corresponds to a single shot measurement taken in a fresh portion of the sample. Red full lines are the R(F)/R(0) trends calculated through Eq. (6); dashed lines are the estimate of the confidence interval.