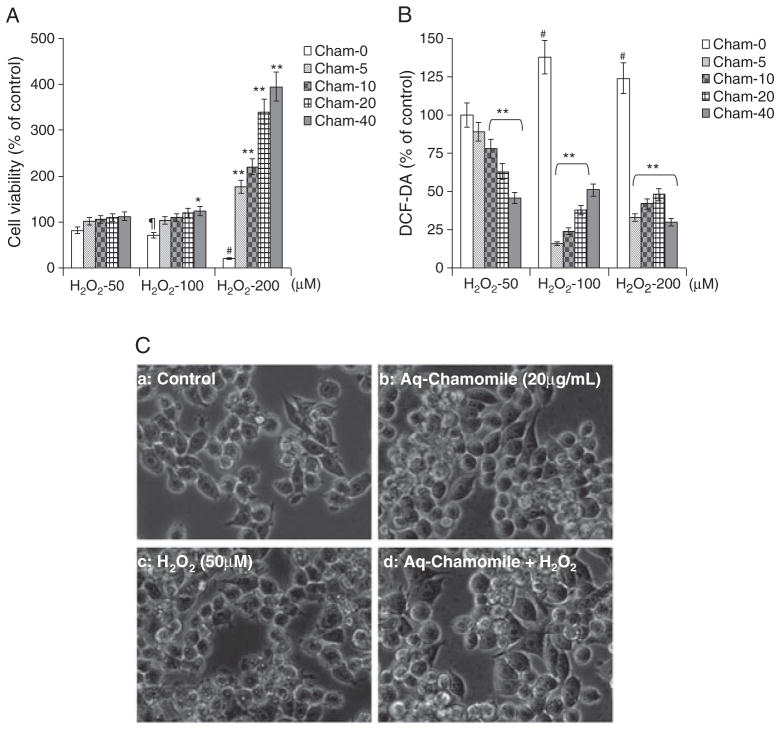
Figure 2.
Effect of chamomile on cell viability and ROS generation with H2O2 in RAW 264.7 cells. (A) Cell viability assay with MTT on RAW 264.7 cells treated with chamomile at concentrations 0–40 μg/mL for 16 h and further challenged with H2O2 at 50, 100, and 200 μM for 6 h; (B) ROS assay with DCF-DA on RAW 264.7 cells treated with chamomile at concentrations 0–40 μg/mL for 16 h and further challenged with H2O2 at 50, 100, and 200 μM for 6 h; (C) photographs of RAW 264.7 macrophages (subpanel a–d) showing cells after treatment with 50 μM H2O2 for 6 h, 20 μg/mL chamomile for 16 h alone and chamomile with H2O2. The bars represent mean ± SD of at least three independent experiments each performed in triplicate, *p <0.05 and **p <0.001 represent significant differences as compared with the chamomile and H2O2 treated group. ¶p <0.05 and #p <0.001 represent significant differences as compared with the H2O2 model group. The details are described in the Materials and methods section.

