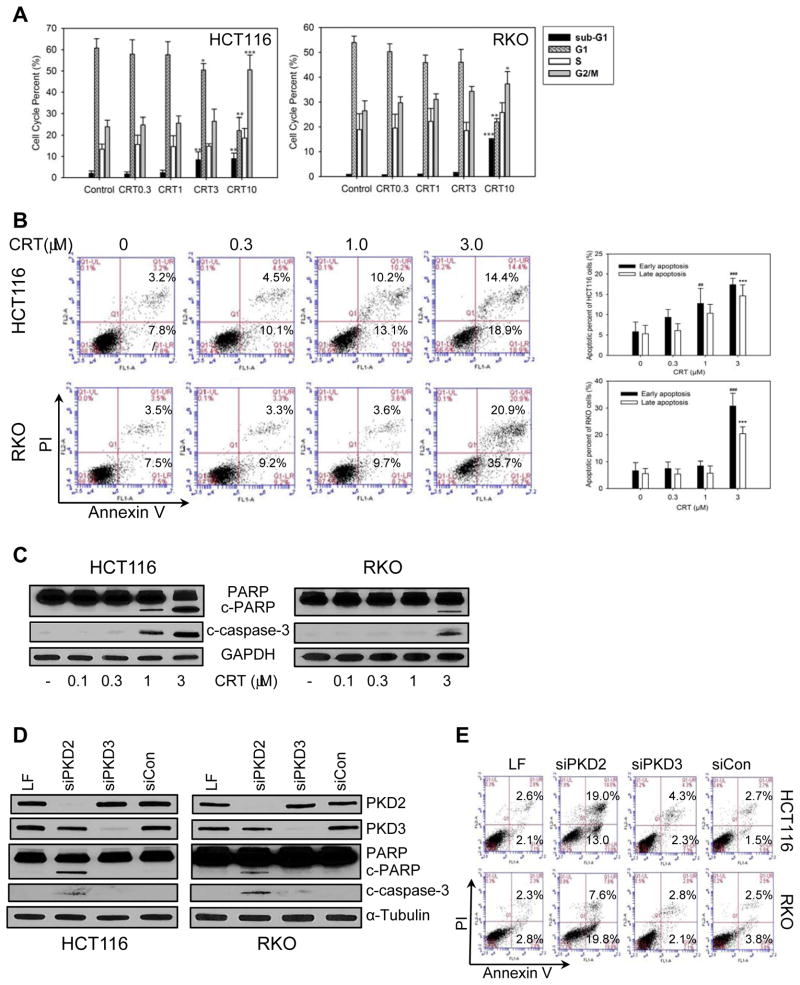
Fig. 2. Effect of PKD inhibition on cell cycle distribution and apoptosis.
HCT116 and RKO cells were incubated with various concentrations of CRT0066101 (0.3–10 μmol/L) for 24 hours. (A) Cell cycle distribution was detected by flow cytometry. Cycle percentages represent the mean ± SD from 3 individual experiments using HCT116 and RKO cells. (B) Apoptotic cells were detected by flow cytometry. Apoptotic cell percentages represent the mean ± SD from 3 individual experiments. (C) Expression of cleaved-PARP and cleaved caspase-3 was determined by Western Blot analysis after 24 hours exposure to CRT0066101. ##: p<0.01, ###:<0.001 early apoptosis vs. control, ***: p<0.001 late apoptosis vs. control. (D) Cells were transfected with 10 nM siRNAs for 48 hours, and expression of cleaved PARP and caspase-3 was analyzed by Western blot. (E) Cells were transfected with 10 nM siRNAs for 48 hours and processed for apoptotic cell detection by flow cytometry.

