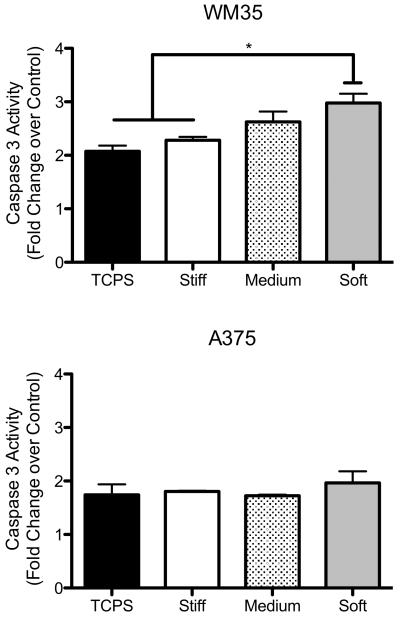
Figure 5.
Apoptosis measured via caspase 3 activity on different culture substrates. Each bar represents the PLX4032-treated sample normalized to its respective control showing the fold increase in caspase 3 activity with drug treatment. None of the A375 changes in apoptosis were statistically different. n = 3 ± SEM. *p < 0.05

