
Figure 1.
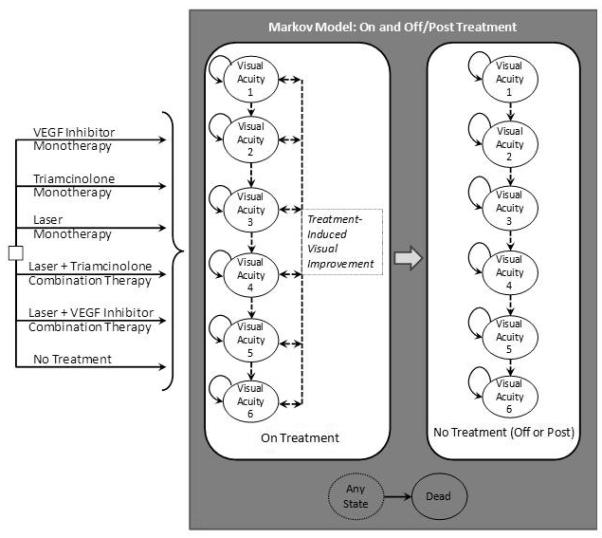
Markov Model Schematic
VEGF=Vascular Endothelial Growth Factor
The six strategy alternatives to the right of the decision node (square box) represent the six strategies for comparison, each progressing within the Markov model.
The gray box represents the Markov model transitions for diabetic macular edema progression. Visual Acuity categories 1-6 represent visual acuity states (Table 1). Solid arrows represent possible worsening (Progression) within a given month, and dashed arrows represent the potential for improvement or progression within a given month while on treatment. On-treatment states are subject to risk of complications (arterial thromboembolic events, glaucoma, cataract, and other major or minor complications). In the base case, treatment was stopped after one year for all strategies, sooner if an arterial thromboembolic event or severe glaucoma.