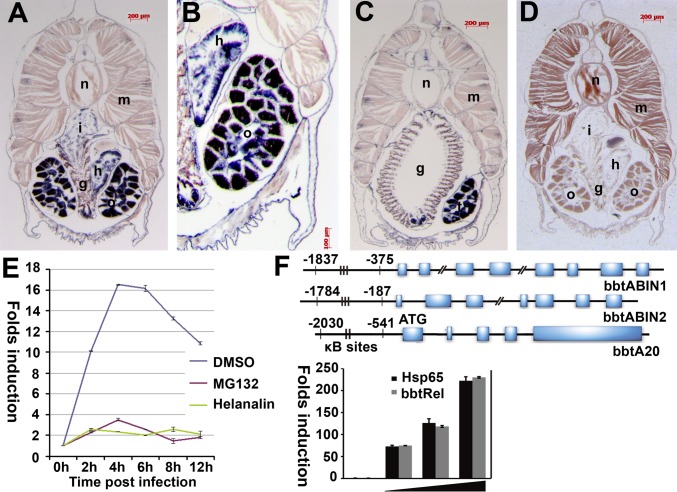
Fig. 2.
Expression patterns of bbtABIN2 and bbtA20. (A) Section in situ hybridization showed that transcripts of bbtABIN2 are abundant in intestine, hepatic cecum, and gonad. (B) Macroscopic view of the hybridization signals of bbtABIN2 in hepatic cecum and ovary. (C) Transcripts of bbtABIN2 are sparse in gill slits but abundant in testis. (D) Negative control of bbtABIN2 using the sense probe. g, gill slit; h, hepatic cecum; i, intestine; m, muscle; n, notochord; o, ovary; t, testis. Blue indicates strong hybridization, and dark brown indicates a weak signal. (E) RT-PCR analyses of expression patterns of bbtA20 after bacterial challenge in the presence or absence of the NF-κB inhibitor helenalin. Results were presented as “fold induction” of mRNA expression done in triplicate, using the 2-ΔΔCt method. Endogenous control for quantification was cytoplasmic β-actin. Values were considered significant at P < 0.05. (F) Sequence analysis indicated that all bbtABINs and bbtA20 possess several conserved κB-binding motifs in the promoter region. A reporter assay confirmed that the region containing two κB-binding sites upstream of the ATG of bbtA20 is essential for the binding to bbtRel. Hsp65 indicates the Homo sapiens p65. Reporter experiments were conducted in triplicate; vertical bars indicate mean ± SD. Data are representative of three independent experiments.

