Fig. 3.
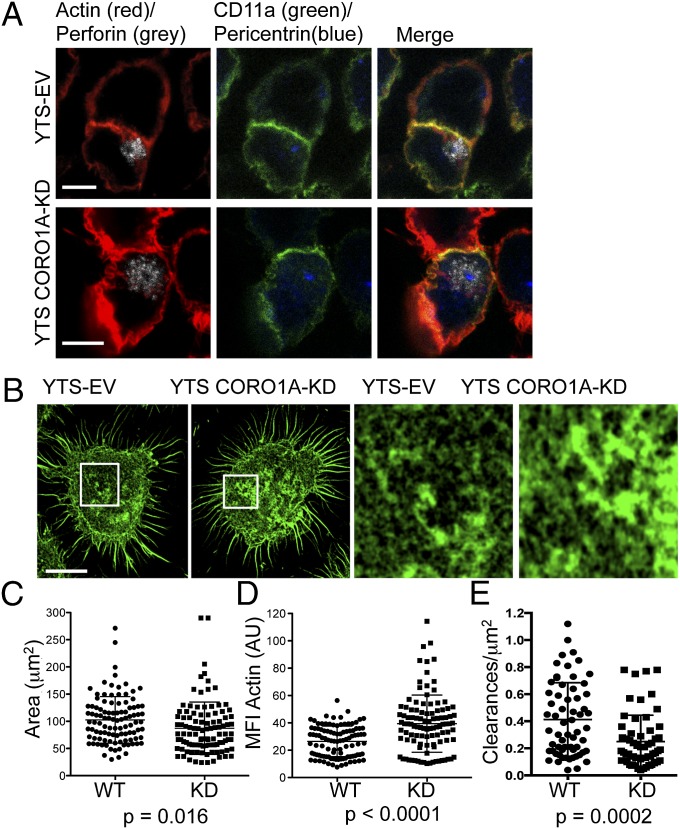
Superresolution imaging defines a requirement for Coro1A in the control of F-actin density at the NK synapse. (A) YTS-EV or YTS-CORO1A-KD cells were incubated with susceptible 721.221 target cells and then fixed, permeabilized, and stained for CD11a (green), F-actin with phalloidin (red), perforin (gray), and pericentrin (blue). (B) YTS-EV or YTS-CORO1A-KD cells were incubated on immobilized activating antibody and then fixed, permeabilized, and stained for F-actin and imaged at the plane of glass by STED nanoscopy. (Right) Detailed structure of F-actin is shown for the highlighted regions. Shown are representative images from four independent experiments. (Resolution: 60 nm.) The area (C; square micrometers) and MFI (D) of F-actin staining were measured for YTS-EV (●) and YTS-CORO1A-KD (■) cells (all excluding cell cortex). Shown are 104 cells from four independent experiments, with one data point representing each cell. (E) F-actin clearances per square micrometer permissive for lytic granule secretion (250–500 nm) were measured for YTS-EV (●) and YTS-CORO1A-KD (■) cells. Each data point represents clearances per square micrometer for one cell. Shown are 60 cells from three independent experiments. (Scale bars: 5 μm.)

