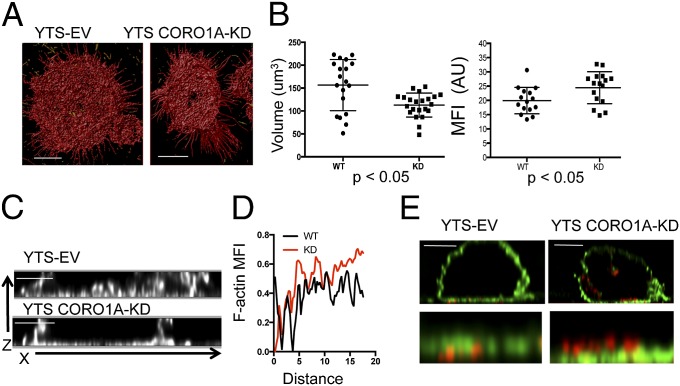
Fig. 5.
Increased density of F-actin in the absence of Coro1A is defined by 3D STED. YTS-EV and YTS-CORO1A-KD cells were immobilized on glass coated with antibody to activating receptor and then fixed, permeabilized, and stained for F-actin. Cells were imaged by time-gated STED in 200-nm slices of the membrane-proximal 2 μm of cells. (A) Images were deconvolved and reconstructed in three dimensions and then surface-rendered. (Scale bars: 5 μm.) (Resolution: z axis, 200 nm.) (B) Volume and MFI of F-actin were measured for YTS-EV (●) and YTS-CORO1A-KD (■) cells. Each data point represents one of 20 cells from three independent experiments. (C) Cells were activated and stained as in A. Shown are representative images in the X,Z plane from YTS-EV and YTS-CORO1A-KD cells. (Scale bars: 2 μm.) (D) Radial intensity profiles of images generated as in C were normalized and plotted for 20 cells. (E) Cells were prepared as in Fig. 4 and imaged in 3D, time-gated STED for F-actin (green) and perforin (red). Shown are representative images from three experiments. (Scale bars: 5 μm.)

