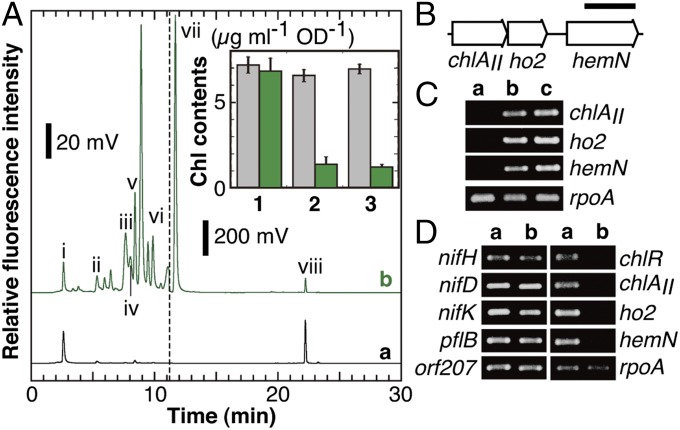
Fig. 3.
Phenotype analysis of NK11. (A) WT and NK11 cells were incubated under micro-oxic conditions for 7 d. Aliquots (100 µL with an OD730 of 100) of the cell suspension were mixed with 900 µL of ice-cold methanol for HPLC analysis. The elution of pigments was monitored by fluorescence emission at 630 nm with excitation at 400 nm (a, WT; b, NK11). The elution profiles from 0 to 11.2 min are enlarged 10 times to emphasize small peaks (see the scale bars). Peaks i to viii were previously assigned as coproporphyrin III (i), Mg-protoporphyrin IX (ii), divinyl protochlorophyllide (iii), monovinyl protochlorophyllide (iv), MPE (v), protoporphyrin IX (vi), demetallated MPE (vii), and Chl a (viii), respectively. (Inset) Comparison of Chl levels of the WT and NK11. WT (gray bars) and NK11 (green bars) cells were grown in BG-11 agar plates containing nitrate (lanes 1 and 2) or BG-110 without combined nitrogen (lane 3) under aerobic (lane 1) or micro-oxic (lanes 2 and 3) conditions (n = 3). (B) The gene organization of the three genes, chlAII, ho2, and hemN, forming a small gene cluster. (Scale bar, 1 kb.) (C) Transcript profiles by RT-PCR for the three genes. WT cells were grown under nitrate-replete/aerobic (lane a), nitrate-replete/micro-oxic (lane b), and nitrate-depleted/micro-oxic (lane c) conditions, and RNA was extracted from the cells. rpoA was used as an internal control. (D) Transcript profiles by RT-PCR for nifHDK and the six genes in WT and NK11 cells. WT (lane a) and NK11 (lane b) cells were grown under nitrogen-fixing conditions, and RNA was extracted from the cells.

