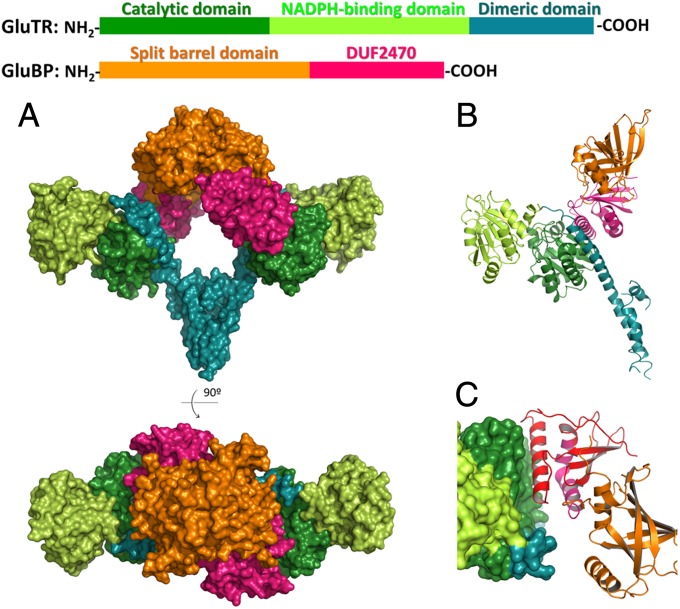
Fig. 1.
The GluTR–GluBP complex. (A) Surface representation of the overall structure, colored by domains. (B) A monomeric half of the GluTR–GluBP complex in ribbon representation showing secondary structure elements. (C) The GluTR–GluBP interface. GluTR is shown in surface representation and GluBP is in ribbon representation. The C-terminal 84-resiude sequence corresponding to the truncated pgr7 mutant is colored in red.

