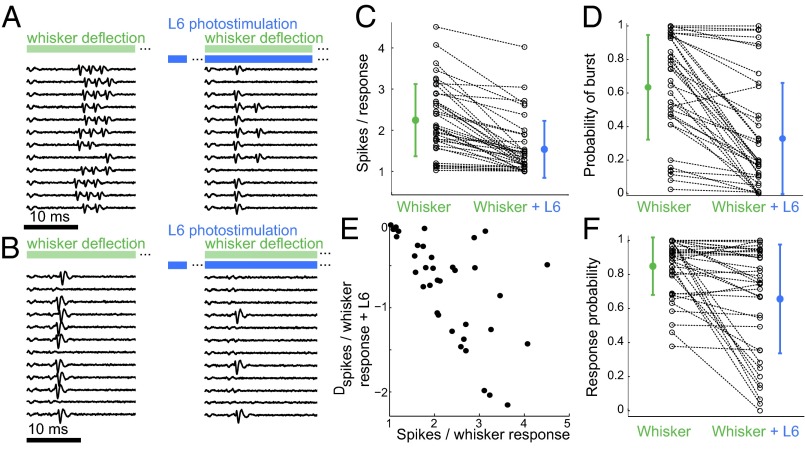
Fig. 2.
L6 activation influences the sensory response mode and the probability of response in the VPM. (A) Juxtacellular recording of a VPM neuron in response to whisker stimulation (Left, green) and whisker stimulation paired with L6 photostimulation (Right, blue). L6 stimulation started 200 ms before whisker stimulation as indicated by the gap in the blue bar. (B) As in A, but for a neuron in tonic mode. (C and D) Population summaries (n = 38) for number of spikes per whisker response (C) and the probability of burst per whisker response (D). Only successful responses were considered; dotted lines indicate pairings for individual neurons. Colored markers show mean values for whisker stimulation alone (green) or whisker stimulation combined with L6 input (blue). Error bars show SD. L6 activation decreased both the number of spikes per whisker response (2.3 ± 0.9–1.6 ± 0.7 spikes per response) (C) and the probability of a burst per whisker response (0.64 ± 0.3–0.33 ± 0.33) (D). (E) Data from C replotted to show how the L6-induced reduction in the number of spikes per whisker response (Dspikes, y-axis) depends on the initial burstiness (x-axis). (F) Summary of the probability of response per whisker deflection alone and per whisker deflection combined with L6 input, Plotting conventions are as in C and D. The average probabilities of response across the populations were 0.84 ± 0.17 for the control condition and 0.66 ±0.32 with L6 activation (P = 2.6*10−4, paired t test, n = 38).

