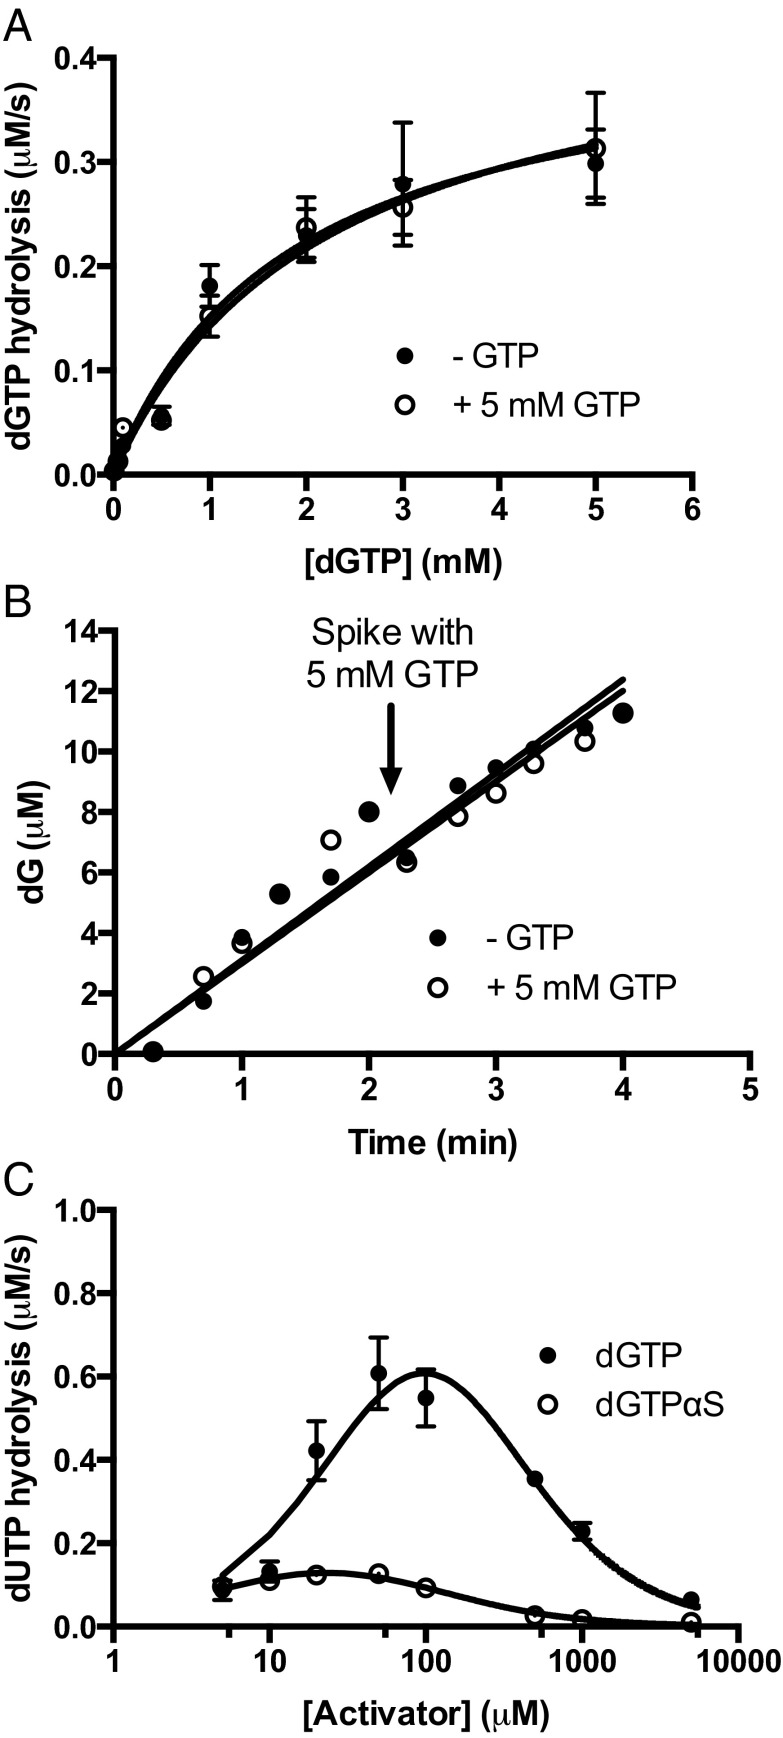
Fig. 2.
Self-activation, transactivation, and inhibition by dGTP. (A) dGTP self-activation of dGTP hydrolysis and transactivation of dGTP hydrolysis by 5 mM GTP. The datasets were normalized to total active sites and are indistinguishable. (B) Addition of 5 mM GTP during steady-state hydrolysis of 25 μM dGTP by 0.5 μM SAMHD1 provides no additional activation. (C) Activation and inhibition of dUTP hydrolysis by dGTP and dGTPαS. Curves were generated using the simulation program Dynafit to obtain the activation and inhibition constants for dGTP (expressions 5, 6, 7, and 8).

