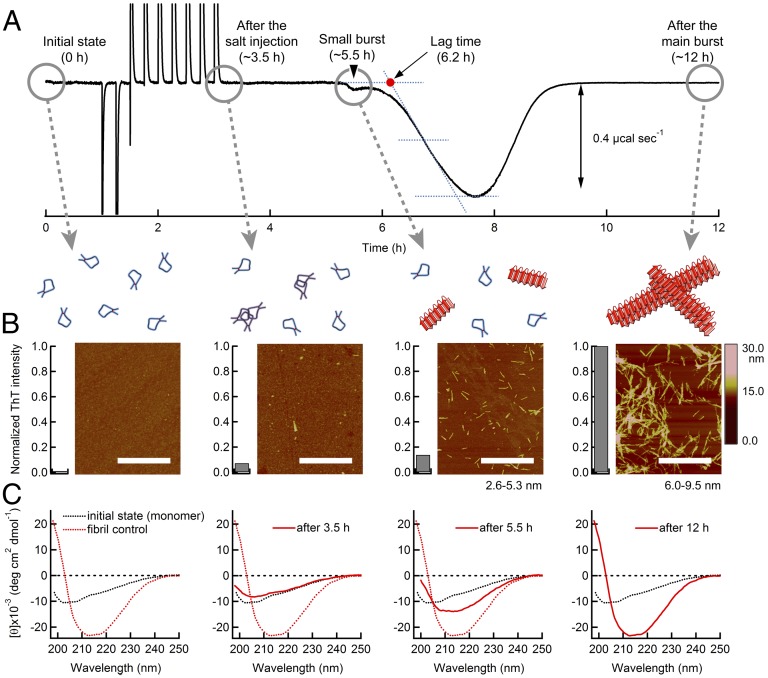
Fig. 3.
Monitoring the kinetics of the amyloid burst of β2m using various approaches. (A) ITC profile of 1.1 mg⋅mL−1 β2m at pH 2.5 and 37 °C. The lag time (red dot) is determined by a baseline and a tangent line at the middle of the major peak. (B and C) Conformational changes in β2m during incubation in an ITC cell characterized using AFM images and ThT fluorescence intensities (B) and the far-UV CD spectra (C) at the four time points: “Initial state (0 h),” “After salt injection (∼3.5 h),” “Small burst (∼5.5 h),” and “After main burst (∼12 h).” Conformations of β2m based on AFM, ThT fluorescence, and CD are illustrated above the AFM images: monomers (blue curves), oligomers (magenta curves), and fibrils (red rectangles). The CD spectra at the respective time points are shown by red solid curves. The spectra of monomers (black dotted curves) and mature fibrils (red dotted curves) are shown for comparison.

