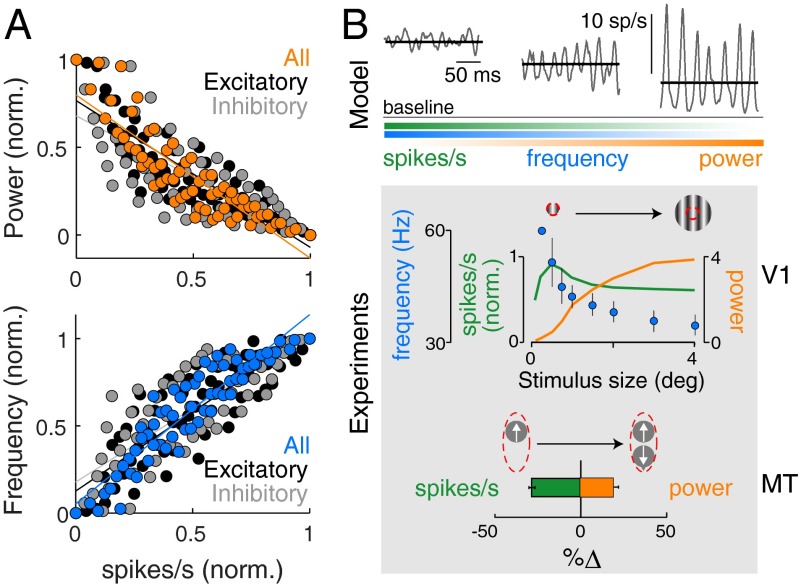
Fig. 3.
Modulation of narrowband oscillations is correlated with the average spiking activity of the neuronal population. (A) Scatter plot of power (Upper) and frequency (Lower) in the population signal vs. the mean spike rate of (i) entire network (colored circles), (ii) excitatory subpopulation (black circles), and (iii) inhibitory subpopulation (gray circles). The normalized values were revisualized from data shown in Figs. 1E and 2C. (B) (Upper) Simulation of scenarios showing more powerful oscillations correlated with reduction of spiking activity. The average spike rate (solid black) was calculated over 20 s of simulation data, and example snippets of oscillatory fluctuations in spike rates are overlain in gray. Baseline spike rate was calculated over all trials across all scenarios. Fading bars schematically summarize the trend of spike rate, oscillatory power and frequency across the three cases. (Lower) V1: Electrophysiological data from the orientation-selective primary visual cortex (V1) of macaques during presentation of oriented stimuli. The plot shows mean spike rate (green), peak gamma-range frequency (blue), and peak gamma-range power (orange) as a function of increasing stimulus size [data estimated from Gieselmann and Thiele (5)]. The gamma power is plotted as a z-score. Red circle indicates boundary of receptive field in visual space of a V1 recoding site. MT: Electrophysiological data from the motion-selective medial temporal cortex (MT) of macaques during presentation of visual motion stimuli. The plot shows difference in mean spike rate (green) and peak gamma-range power (orange) between the cases when motion stimulus is presented in preferred direction alone (top left symbol) and when it is copresented with a motion stimulus in anti-preferred direction (top right symbol) [data estimated from Ray et al. (15)]. Red oval indicates boundary of receptive field of an MT recording site. Frequency data were not available.

