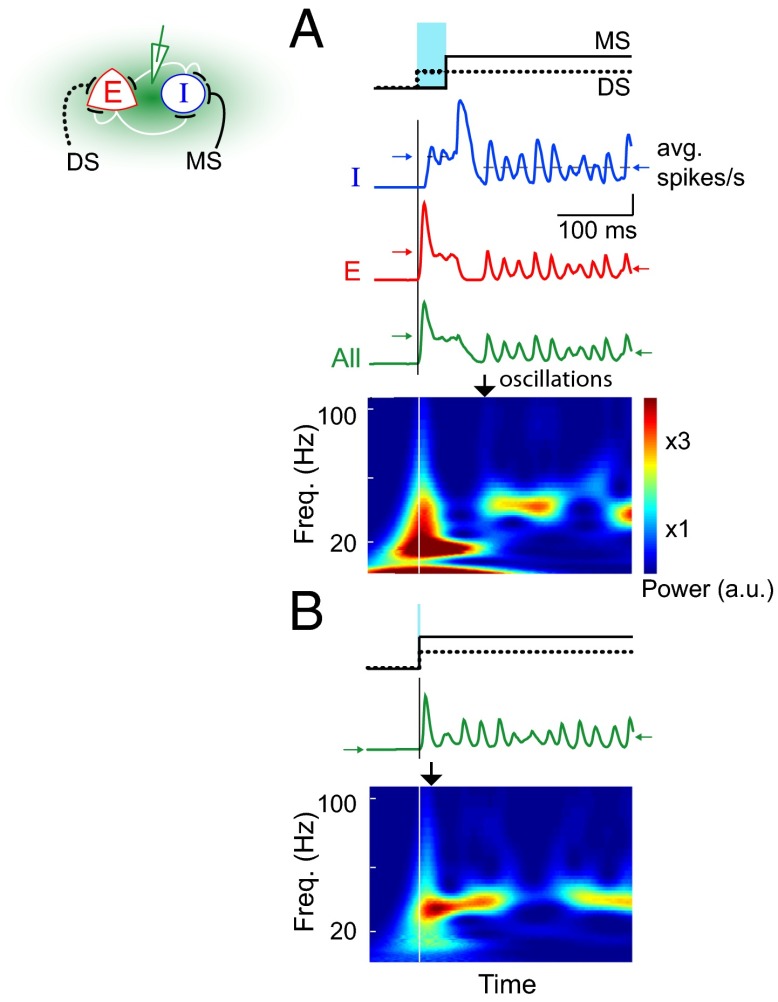
Fig. 5.
Relative timing of DS and MS stimulation of inhibitory neurons determines onset of strong oscillations. (A and B) The top row indicates latency of MS stimulation relative to DS stimulation to the inhibitory neurons in the network. Light blue bar highlights the temporal offset between the two pathways. Colored traces show the fluctuations in population firing rates for an example trial (red, excitatory; blue, inhibitory; green, all). Horizontal arrows indicate the steady state average population activity before (left) and after (right) the onset of monosynaptic stimulation. Time-frequency plots below show spectral contents of the overall population activity for the example trial. Vertical lines mark the onset of DS stimulation. Black vertical arrows indicate the approximate onset of narrowband increase in power. Early activation of MS pathway resulted in earlier onset of powerful oscillations.

