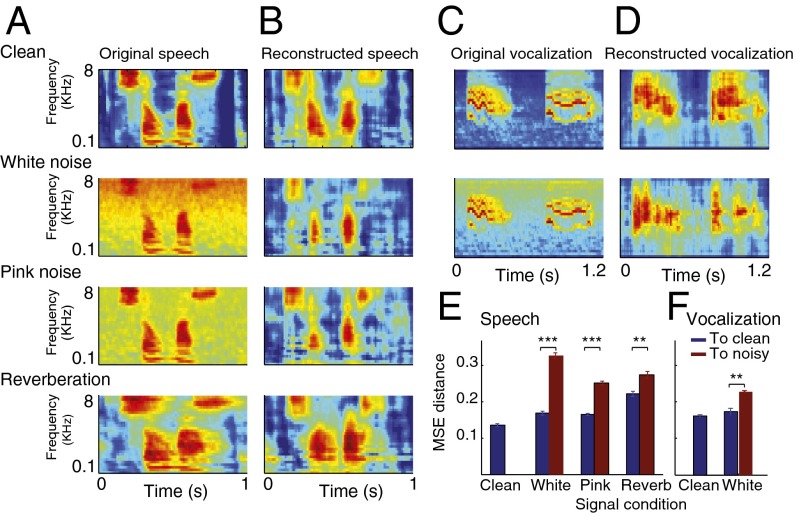
Fig. 2.
Reduced stimulus distortions in spectrograms reconstructed from the A1 population response. (A) Original and (B) reconstructed spectrograms of clean and distorted speech. The reconstructed spectrograms from the population response of A1 neurons to the clean and distorted speech were more similar to the spectrogram of the clean speech signal (first panel in A) than to those of the distorted signals (second through fourth panels in A). (C) Original and (D) reconstructed spectrogram of clean and noisy ferret vocalization sounds, showing a similar effect as in A and B. (E and F) MSE distance between the spectrograms reconstructed from neural responses and clean (blue) or noisy (red) original spectrograms. In all distortions, reconstructions were closer to the clean than to the noisy stimuli (**P < 0.01, t test), both for speech and ferret vocalization sounds. Error bars were estimated across different speech samples.

