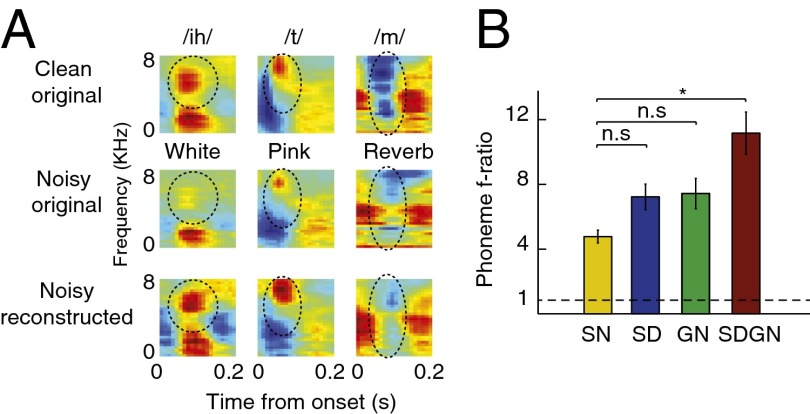
Fig. 6.
Difference between MSE distance of reconstructed spectrograms and original clean and noisy spectrograms. (A) Examples of average phoneme spectrograms in original clean, original noisy, and reconstructed noisy samples. Different distortions heavily mask the acoustic features of phonemes, such as second formant of vowel /ih/ in white noise (circled), spectral peak of plosive /t/ (circled), or midfrequency gap of nasal /m/ (circled). These features are highly restored in the reconstructed spectrograms from neural responses to distorted speech. (B) Phoneme separability index estimated from reconstructed spectrograms using SN, SD, GN, and SDGN predicted responses, showing a significant improvement in phoneme discriminability by SDGN model (*P < 0.05, t test).

