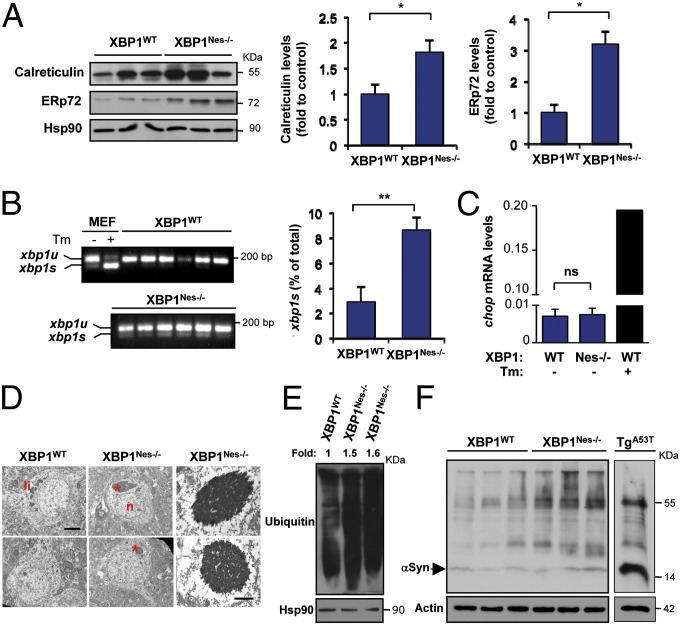
Fig. 2.
ER stress in XBP1-deficient SNpc. (A) (Left) Levels of the ER stress-responsive proteins calreticulin and ERp72 were determined by Western blot analysis in midbrain tissue dissected from XBP1WT and XBP1Nes−/− mice. Hsp90 was measured as loading control. (Right) Relative levels of calreticulin and ERp72 were estimated after normalization with Hsp90 (n = 5 for calreticulin; n = 3 for ERp72). (B) (Left) XBP1 mRNA splicing levels were determined by RT-PCR in mRNA extracted from dissected midbrain from XBP1WT and XBP1Nes−/− mice. Mouse embryonic fibroblast (MEF) cells treated for 24 h with 10 μg/mL of Tm served as a positive control. (Right) Quantification of the xbp1s splicing. Values represent the percentage of xbp1s relative to total xbp1 mRNA expression (xbp1s + xbp1u) (n = 6 per group). (C) Chop mRNA levels were determined in dissected SNpc of XBP1WT and XBP1Nes−/− mice using real-time PCR (n = 3 per group). As a positive control, chop mRNA levels were analyzed in animals injected with 10 μg of Tm directly into the SNpc. Statistical analyses were performed using the Student t test. Data are reported as mean and SEM. *P < 0.05; **P < 0.01; ns, not significant. (D) EM images of dopaminergic neurons in the SNpc of XBP1WT and XBP1Nes−/− mice. (Left) Representative lower-magnification images showing the nucleus (n), lipofuscin (li), and protein aggregates (*). (Scale bar: 5 μm.) (Right) Higher-magnification images of protein aggregates observed in XBP1Nes−/− mice. (Scale bar: 1.2 μm.) (E) Total ubiquitinated proteins were detected by Western blot analysis in dissected SNpc of XBP1WT and XBP1Nes−/− mice. Hsp90 was monitored as a loading control. Relative levels of total ubiquitinated proteins were estimated after normalization with Hsp90 and expressed as fold of change to the WT control, as indicated at the top of the gel. (F) αSynuclein (αSyn) protein levels were evaluated in midbrain dissections containing the SN from XBP1WT and XBP1Nes−/− mice by Western blot analysis. Actin was monitored as a loading control. Each lane represents an independent animal. αSyn monomers are indicated by an arrowhead. As a positive control for aggregation, brain extract from αSynA53T transgenic mice was run in the same gel.

